Everything an OM needs, from the data you already have.
OfferingStack handles the slow parts of listing marketing: pulling facts out of documents, researching the location, drawing maps and laying out pages that hold up in print.
Location intelligence
The location story, with sources.
From the address, OfferingStack works out drive-time reach, nearby amenities, neighbouring businesses, transit and road access. Each figure carries its source and the date it was pulled.
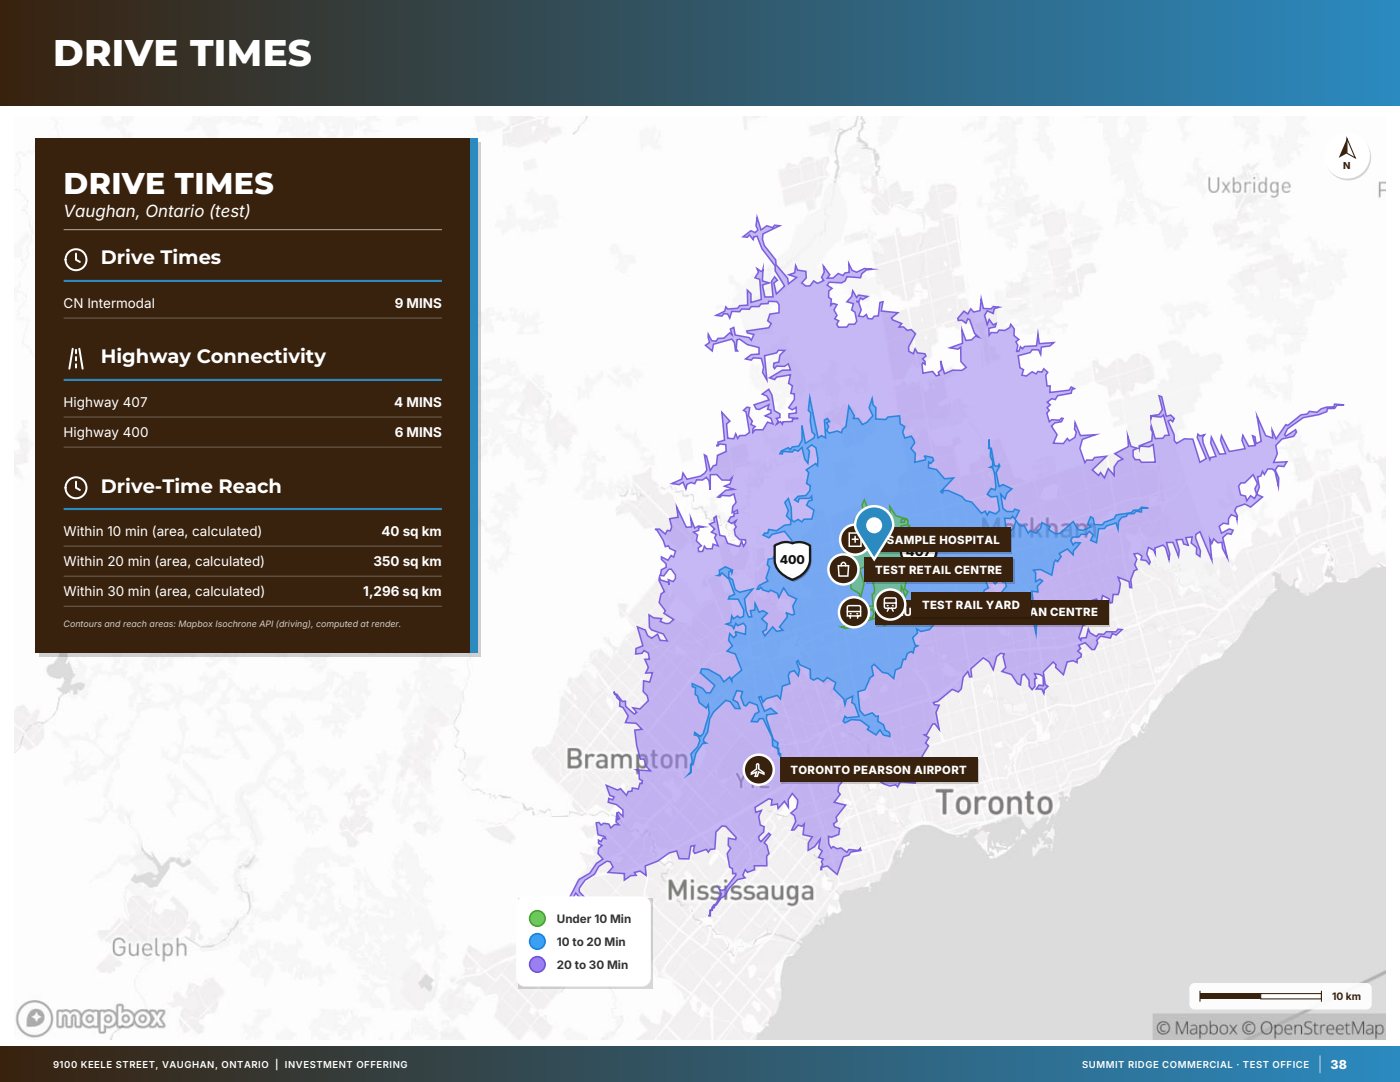
10, 20 and 30-minute drive-time areas
Drive times to the airport, rail, city centre, ports and border crossings
Amenity counts within 3, 5 and 10 km, rounded down
Neighbouring occupiers, transit stops and routes, retail anchors
“Why this location” bullets written only from pulled figures
Sample · fictitious test listing · p. 38Drive times10/20/30-minute isochrones with highway and connectivity tables.
Cartography
Maps drawn for print.
Generated maps carry the details brokers usually add by hand: road labels set along the road, highway shields, a north arrow and scale bar, and callout cards with leader lines.
Comparables map numbered to match the table rows
Far points shown as edge pointers instead of zooming out to the region
Points more than 25 km from the site left off, with a warning
Satellite or muted basemaps, site pin in your brand colour
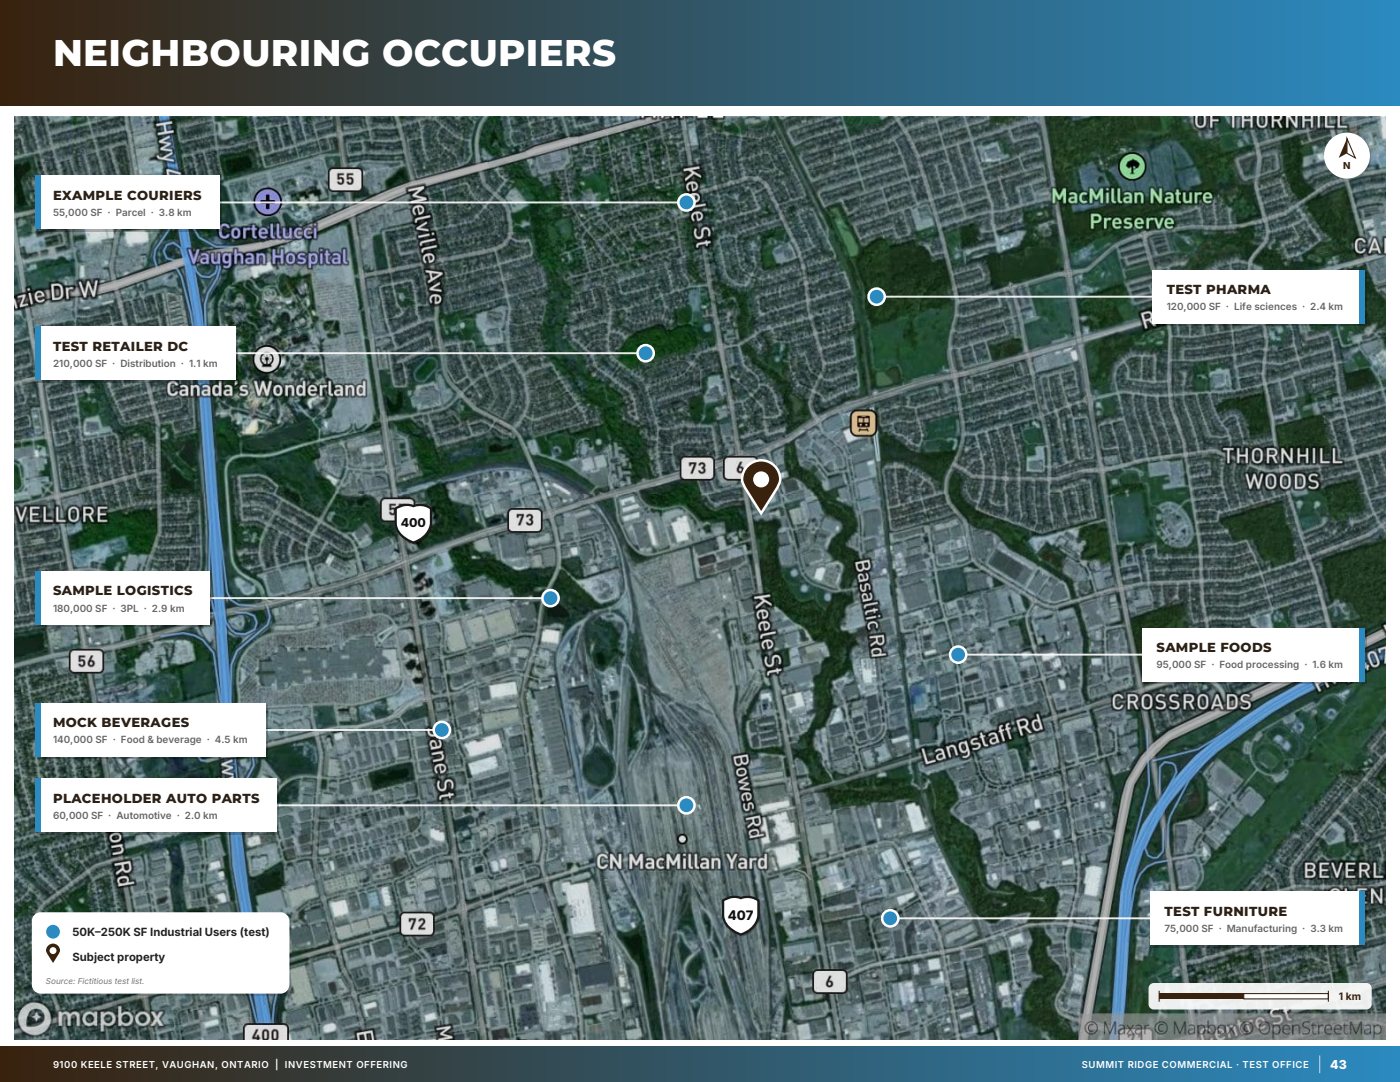
Sample · fictitious test listing · p. 43Neighbouring occupiersCallout cards with leader lines to each neighbouring business.
Tenancy and financials
Numbers you can defend.
Tenancy and financial pages are built from your rent roll and pro forma. Anything OfferingStack calculates is labelled as calculated, so readers can tell your figures from derived ones.
Rent roll at a glance, stacking plan, tenant profiles, lease abstracts
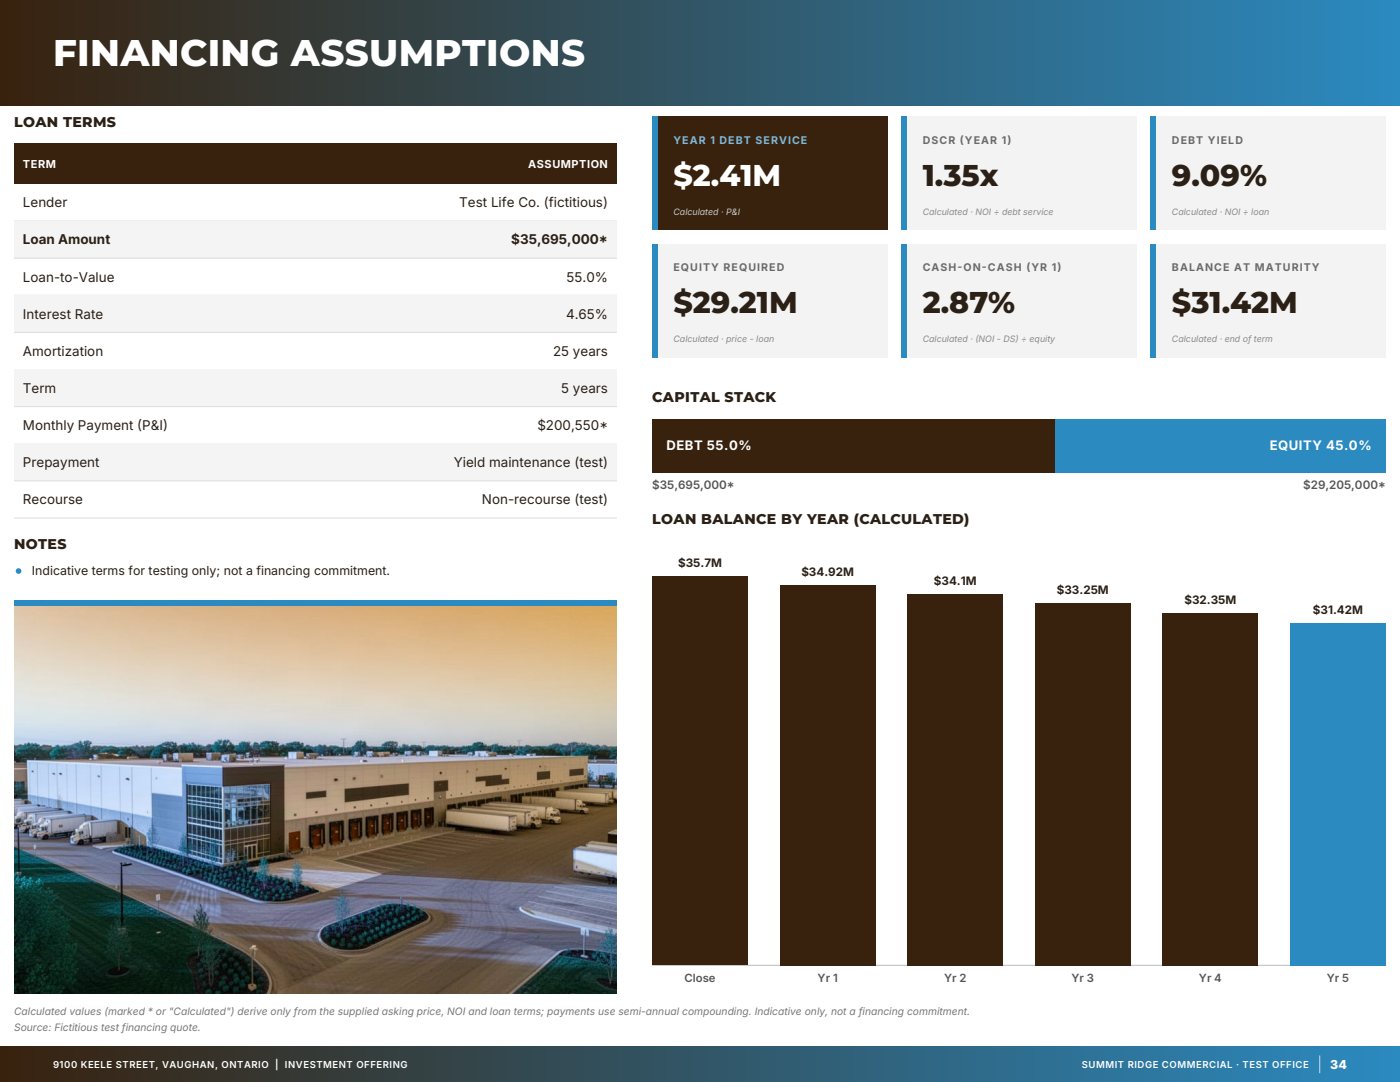
Sample · fictitious test listing · p. 34Financing assumptionsDebt service, DSCR, debt yield and equity, each labelled as calculated.
Design and output
Your brand, laid out properly.
Six themes, including a full-bleed panel layout in the style of leading brokerage brochures. Your colours, fonts, logo and co-brand logos run through every page.
Themes: Panel, Banner, Frame, Editorial, Bold and Minimal
Letter or A4 landscape, with print bleed and crop marks
Links and fillable form fields kept in the PDF
Photos straightened and balanced, never retouched
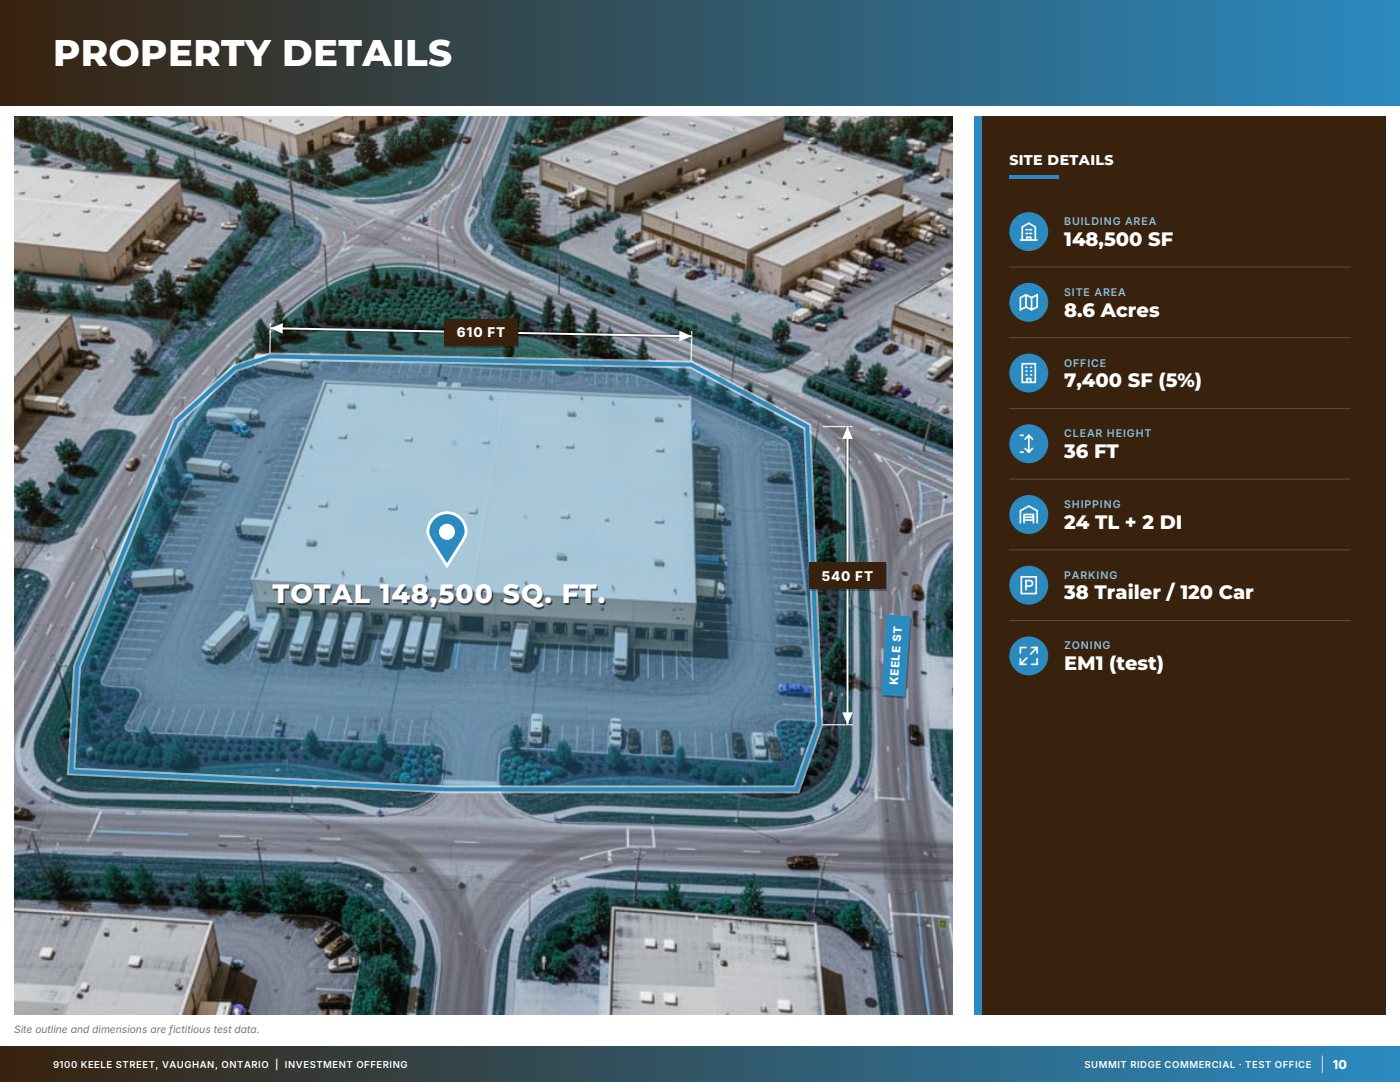
Sample · fictitious test listing · p. 10Property details over aerialSite outline, dimension lines and a spec column drawn from your data.
The full list
What ships today
Updated as features ship. See the changelog for dates.
Intake and data
Fact-sheet extraction from PDF, Word, Excel, CSV, images or pasted text, with the page and quote for every fact
Guided questions for the output you chose, with answer, skip field or skip page
CSV and Excel import on every table; header-aware paste with a per-cell error preview
Asset-specific fields: clear height, doors, ESFR, power and yard for industrial; floor plates and parking for office; frontage and co-tenancy for retail; suite mix for multifamily; servicing for land
Completeness meter that shows which pages are still thin
Research and copy
AI research for zoning, demographics, market, occupiers, property records, transit and infrastructure
A source link and confidence on every researched fact; accept or reject one at a time
Saved research reused for 30 days, with “Search again” and “Clear saved”
Copy drafts that drop any sentence with a figure not found in your data
Place-name check: warns when the copy names a different town than the property
Location and maps
Drive-time areas at 10, 20 and 30 minutes; connectivity tables to airports, rail, ports, border crossings and nearby cities
Amenity counts within 3, 5 and 10 km, rounded down, with source and date
Neighbouring occupiers, transit stops and routes, retail anchors
Road labels set along the road, highway shields, north arrow and scale bar
Comparables map, area development map, aerial context callouts
“Refresh location data” after an address change; location sections cleared when the pin moves