Offering memorandum
Sale and lease comparables in an offering memorandum: choosing, presenting and mapping them
How to choose sale and lease comparables for a commercial OM or BOV, what columns to show, how to map them, and how to stay accurate and fair.
What comparables are for
Comparables (comps) are recent transactions and current listings of similar properties that help a reader judge price or rent. In an offering memorandum they support the asking price or the pricing guidance; in a broker opinion of value they are the evidence behind the range; in a lease brochure they show a tenant how the asking rent sits in the market.
Comps are persuasive only when they are honest. Buyers and their appraisers will run their own search, so a table that leaves out the obvious recent sale down the street, or that stretches the definition of “comparable”, costs credibility on every other page.
Choosing sale comparables
Start with the questions a buyer’s analyst will ask: what sold, how similar is it, how recently, and on what basis. Similarity matters more than proximity, but both count.
- Asset type and use: industrial with industrial, retail plaza with retail plaza, development land with land of similar zoning.
- Size band: a building half or double the size of the subject may trade on a different basis per square foot.
- Location: the same node or submarket first, then comparable nodes, and say which is which.
- Date: the most recent sales you can confirm; older sales need a reason to be included.
- Basis: vacant possession or investment, freehold or leasehold, arm’s length or not, and whether the price included anything unusual such as a leaseback or vendor financing.
Five to eight good comps usually say more than fifteen weak ones. If the market is thin, say so instead of padding the table.
Choosing lease comparables
Lease comps support the rent assumptions in a pro forma or the asking rent in a lease brochure. Match the lease type (net or gross), the unit size, the space type (warehouse, office, retail at grade) and the date the deal was made. Report rent on the same basis throughout, usually net rent per square foot per year with TMI shown separately, and note material incentives such as free rent or tenant improvement allowances when you know them, because they change the effective rent.
Columns that make a comps table useful
A comps table is read across and down: across to understand one deal, down to compare them. Keep the columns consistent and the units stated in the header.
- Address and municipality, with a number that matches the map.
- Date of sale or lease commencement.
- Building area and site area, with the measurement basis.
- Price, and the calculated price per square foot of building or per acre of land.
- For investment sales, the cap rate if it is known and how it was derived.
- For leases: tenant or unit, area, net rent per square foot, term and lease type.
- A short note on anything that makes the deal unusual.
Label calculated figures as calculated. A price per square foot you derived from a reported price and a reported area is not the same as one the parties published.
Comparing unlike properties without overreaching
No comp is identical to the subject. One has higher clear height, another a larger yard, a third sold with a short-term leaseback. Readers expect you to point out the differences that matter; they do not expect a marketing document to turn them into precise dollar adjustments.
A practical approach is a short comment column or a few sentences under the table: “Comp 3 is newer with 32 ft clear; comp 5 sold vacant to a user; comp 6 is in a stronger node with transit access.” That lets a buyer weigh each comp without the document claiming a formal valuation. Numerical adjustment grids belong in an appraisal prepared by a qualified appraiser, or in a clearly framed broker opinion of value.
Watch for the differences that move price per square foot the most: building age and condition, site coverage and outside storage, office finish as a share of the building, lease status (vacant or tenanted), and the deal terms themselves. A comp that included vendor financing, a leaseback at an above-market rent, or a portfolio allocation may not reflect a single-asset price at all.
Comps for land and development sites
Land is usually compared per acre or per hectare, and for development sites often per buildable square foot as well, because two sites of the same area can carry very different permitted density. Group land comps by planning status where you can: unserviced or serviced, designated or zoned, with or without site plan approval. A serviced, zoned employment parcel and a raw parcel awaiting an official plan amendment are not the same product, even on the same road.
Note the site area basis (gross, or net of road widenings, easements and environmental setbacks) and the frontage when it matters. If the buildable area comes from a concept plan rather than an approval, say so.
Comps in an OM, a BOV and a lease brochure
The same comps can appear in several documents, but the emphasis changes. In an OM, comps support the pricing story and are usually limited to the strongest recent sales. In a broker opinion of value, comps are the main evidence and the seller wants to see the full picture, including the sales that argue for a lower number and the competing listings a buyer will compare against. In a lease brochure, lease comps and competing availabilities matter far more than sales. Keep one master list of comps for the listing and choose from it for each document, so the figures never disagree.
Mapping the comps
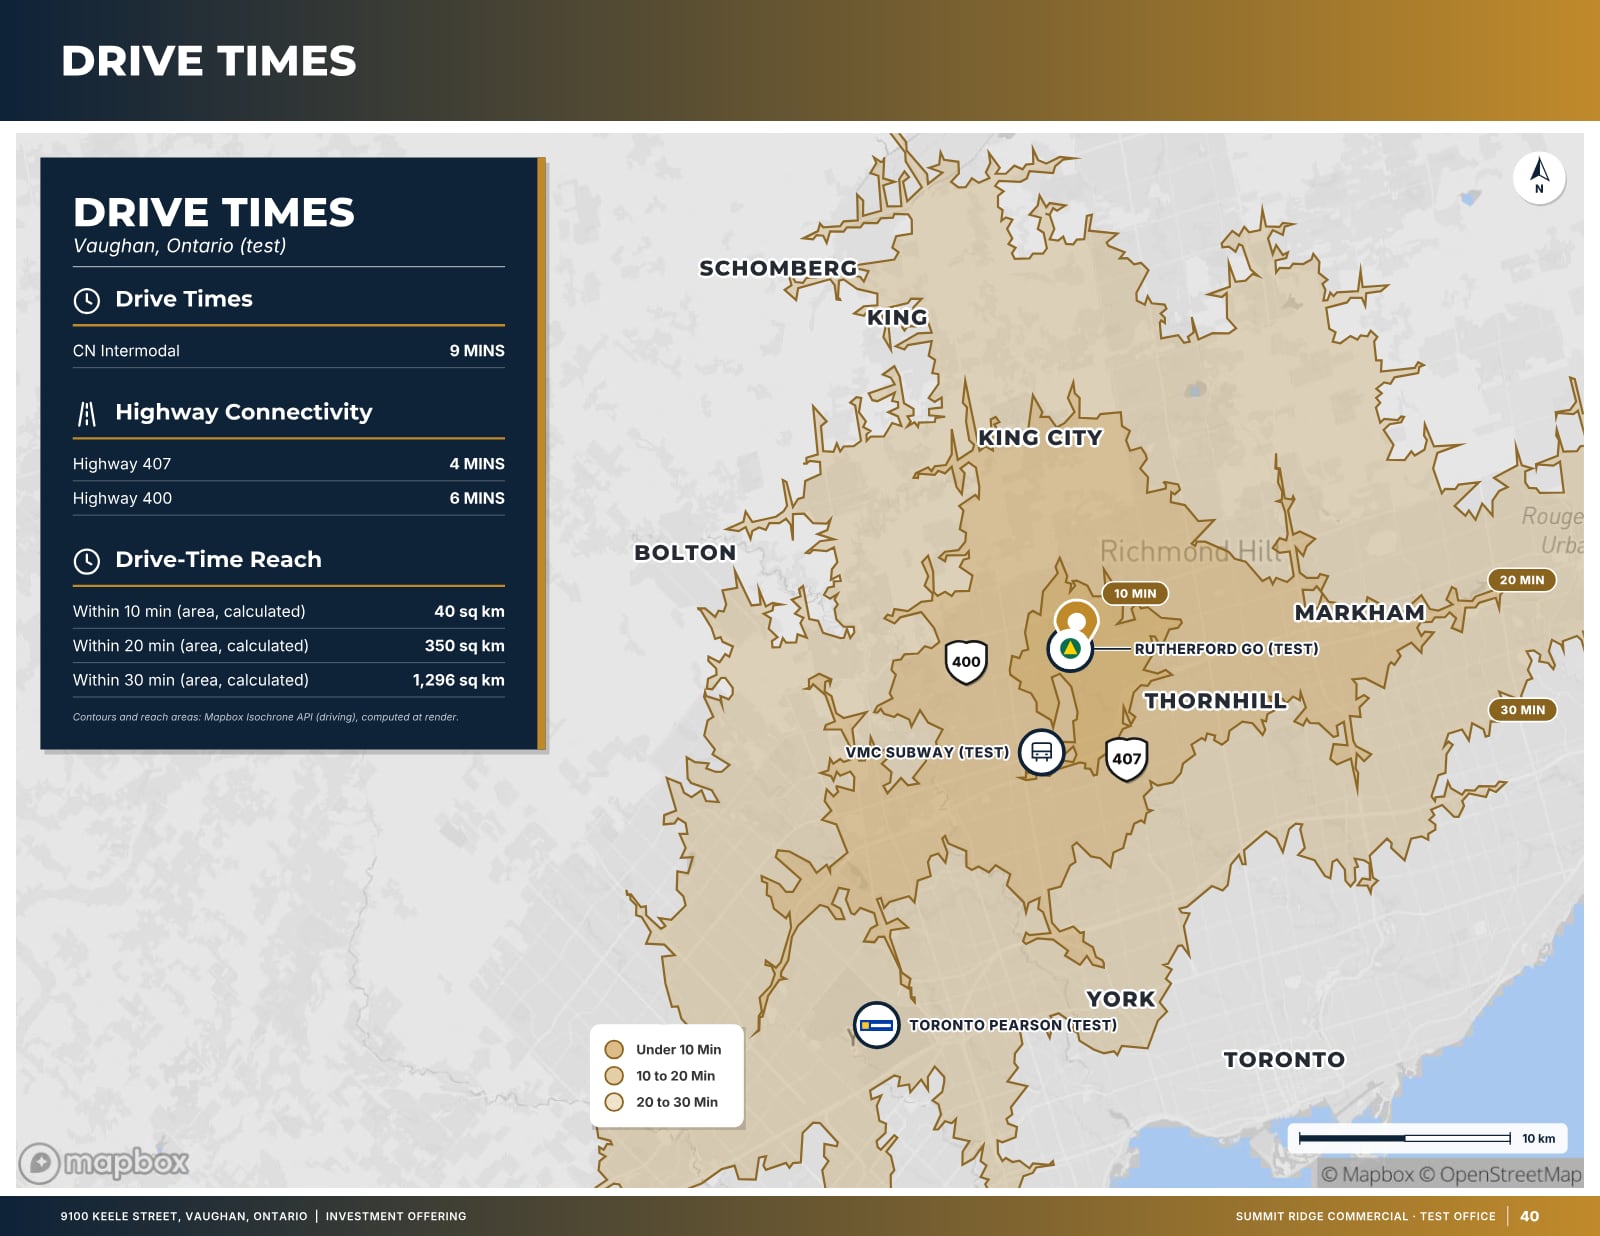
A map turns a table into an argument: the reader sees at once whether the comps cluster around the subject or are scattered across a region. Number each comp to match its table row, mark the subject clearly, and frame the map on the comps and the subject rather than on the whole city. If one comp is far away, say so in the table rather than zooming the map out until everything else is a dot.
Separate symbols or a legend for sales, leases and current listings help when they share a map.
Competing listings: the comps buyers are also looking at
Closed transactions show where the market has been; properties still on the market show what a buyer can choose instead today. A short “on the market” table with the asking price or rent and the distance from the subject is useful in a lease brochure and in a BOV, where the seller needs to see the competition. Present competing listings factually, with their asking figures as advertised, and avoid comments about other brokers’ listings.
Sources, confirmation and fairness
Every comp should have a source you can name: the land registry or a transaction service, the brokerage that completed the deal, the parties themselves, or a published report. Note where a figure is unconfirmed. Respect confidentiality: some deal terms are given to you on the understanding that they will not be published, and those stay out of a marketing document.
Keep comps consistent with the rest of the document. If the OM argues for a price per square foot, the property overview must use the same area basis, and the cap rate in the pricing section must reconcile with the NOI on the operating statement.
How OfferingStack lays out comparables
In OfferingStack you enter each comparable once and the engine builds the pages: a Sale Comparables table and a Lease Comparables table (continued across pages when the list is long), a Comparables Map whose numbers match the table rows when the comps have locations, and an On the Market page for competing listings with their asking figures, a calculated distance and a numbered map. Price per square foot on sale comps is calculated and labelled. Pages without comps are left out, and you review every page before it is distributed.
What these pages look like
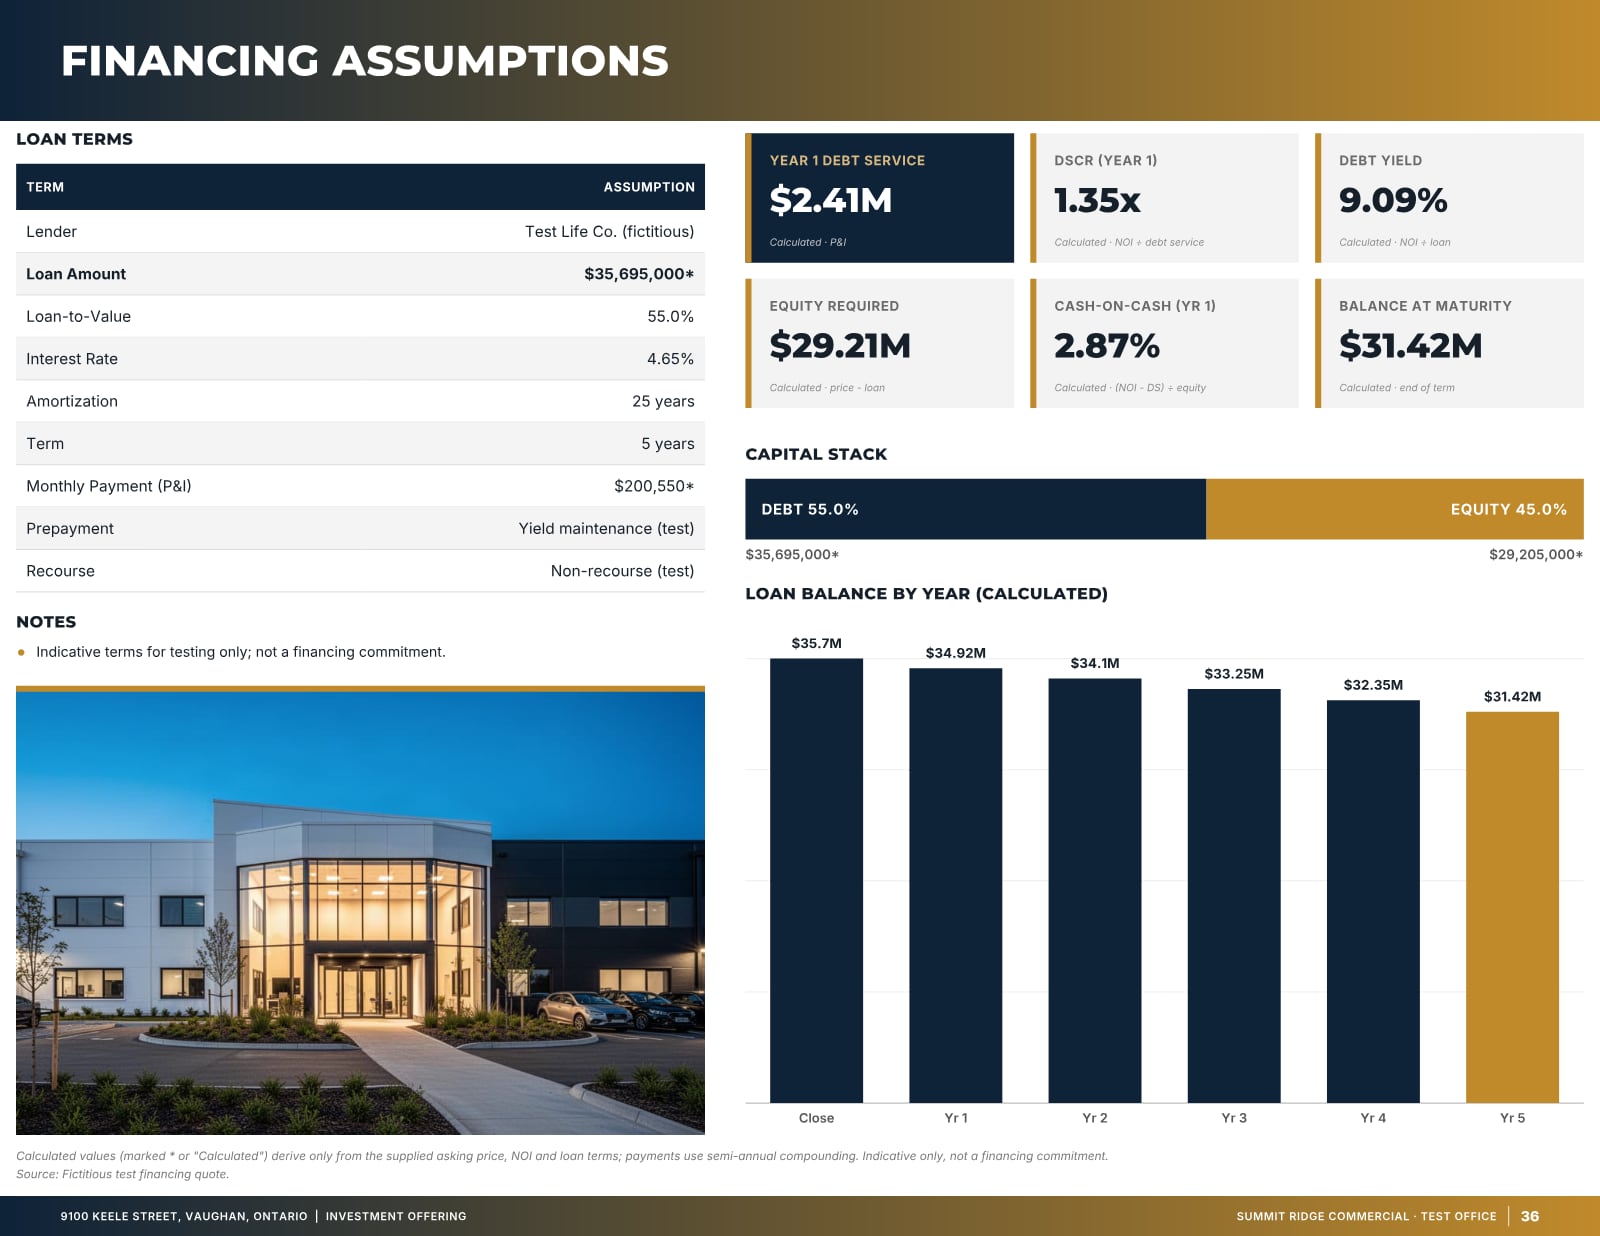
Sample pages are generated by the product from a fictitious test listing (9100 Keele Street, "Summit Ridge Commercial" test brand). Figures marked (test) are not real.

Related
Last updated 2026-10-14. General information for commercial real estate professionals, not legal advice.
Start with the fact sheet you already have.
Upload it, answer only what’s missing for the output you choose, and review a watermarked preview before you buy anything.