CRE marketing guide
Demographics in commercial real estate brochures and OMs: sources, trade areas and how to present them
How to choose and present demographic and labour data in a CRE brochure or OM: census sources in Canada and the US, trade areas and labour sheds.
What demographics are for in a listing
In a commercial real estate brochure or OM, the demographic pages answer one question for the reader: are the people this property needs within reach? For a retail tenant that means customers: population, households, income and growth around the site. For an industrial or office occupier it means workers: the size and make-up of the labour force within a reasonable commute. For an investor it means the depth and direction of demand over the hold period.
Because those questions differ, a good demographics page is chosen for the asset, not copied from the last listing. A grocery-anchored plaza and a distribution building on the same road need different numbers.
Where the numbers come from
Most listing demographics in North America come, directly or through a data vendor, from the national statistical agencies.
- Canada: Statistics Canada’s Census of Population, run every five years (the most recent full release is the 2021 Census). Data is published for geographies down to dissemination areas, small units of a few hundred to a few thousand people, as well as census subdivisions (municipalities) and larger regions.
- United States: the U.S. Census Bureau’s American Community Survey (ACS). The 5-year estimates cover every census tract and block group and are updated each year; the decennial census provides exact counts for a smaller set of questions.
- Vendors: commercial providers model current-year estimates and projections from these sources. Useful, but the method and the year should be stated, and projections should be labelled as projections.
Whichever source you use, record the product, the geography and the year. “Population 48,000” means little; “Population within 3 km: 48,000 (Statistics Canada, 2021 Census)” can be checked.
Choosing the trade area
The same site can show very different numbers depending on how the surrounding area is drawn. The common choices each have a place.
- Radius rings (for example 1, 3 and 5 km, or 1, 3 and 5 miles in US listings): simple and comparable between listings, but they ignore highways, rivers and real travel patterns.
- Drive-time areas (for example 10, 20 or 30 minutes): closer to how customers and workers actually reach a site, and the better basis for labour and regional retail. State the travel assumptions and date.
- Municipal or census boundaries: useful context for growth and policy, but rarely the area a tenant cares about.
Use the same rings or drive times throughout the brochure, so that the map and the numbers describe the same area. Census areas rarely match a ring exactly, so explain how partial areas were treated, for example by including areas whose centre falls inside the ring.
What to show for each property type
Retail
Population and households in each ring, household income, age profile, growth since the previous census, and daytime population where available. Traffic counts and nearby anchors belong alongside, on the same page or the next.
Industrial
Labour force within a commute, the share in manufacturing, transportation and warehousing, and unemployment or participation rates. A labour shed (the workers who can reach the site within a set drive time) is more useful than a 1 km ring around a business park.
Office
Labour force by occupation and education within commuting range, and transit access. Tenants weigh where their staff can live and travel from.
Multi-family and land
Population and household growth, household size, tenure (owners and renters), and age profile. For land, show growth in the wider municipality as well, and link it to the official plan or comprehensive plan where relevant.
Presenting the numbers honestly
- Label the source and year on the page, not only in an appendix.
- Round sensibly: the census is an estimate, so 48,000 reads more honestly than 48,213 for a ring total.
- Mark estimates and projections as such, and never mix years in one table without saying so.
- Keep the units of the country: kilometres in Canadian listings, and miles where the US audience expects them, but do not mix them on one page.
- Do not fill gaps with averages from elsewhere. If a figure is not available for the area, leave it out and say why if needed.
- Avoid vague claims such as “affluent area” or “huge labour pool” unless the numbers on the page support them.
A simple layout works best: a map of the trade area with the rings or drive times, a short table with three to six figures per ring, and a one-line takeaway that states what the numbers mean for this property.
Building a labour shed for an industrial or office listing
A labour shed describes the workers who live within a realistic commute of the property. For many industrial and office listings it is the most persuasive demographic page, because hiring is often the occupier’s hardest problem and the first question its site selection team asks.
- Pick the drive time that matches the use: shift-based industrial roles often draw from a shorter commute than head-office roles. State the minutes and the travel assumptions.
- Count people where they live, not where they work: census labour force figures are by place of residence, so they show who could commute in.
- Break the labour force down by the industries and occupations that matter for the likely tenants, such as manufacturing, transportation and warehousing, or professional and technical services.
- Add context the reader can check: unemployment or participation rates for the same area, and the highways or transit lines that make the commute work.
- Show the shed on a map with the same drive-time outline used for the numbers.
Keep the claims proportionate. A labour shed shows how many people could reach the site, not how many are looking for work; say so if a reader might take it the other way.
Canadian and US listings: practical differences
Readers who work across the border notice the differences quickly. Census years differ: Canadian figures typically come from the most recent five-yearly census, while US ACS 5-year estimates cover a rolling five-year period and are labelled with that period. Geographic units differ: dissemination areas in Canada, tracts and block groups in the US. Income measures differ in definition and currency. Say which you are using and do not compare Canadian and US incomes side by side without noting the currency and the year.
Privacy rules also shape the data. Both agencies suppress or round figures for very small areas to protect respondents, so some small rings will show rounded or missing values. That is expected and should be shown as it is.
Common mistakes
- Copying a demographics page from a different listing and changing only the address.
- Using rings for an industrial building where a drive-time labour shed would tell the real story.
- Showing projections without a source or method.
- Mixing a 5 km ring on the map with 5-mile figures in the table.
- Presenting a labour shed as the number of people available to hire, rather than the number who could reach the site.
- Leaving out the date, so readers cannot tell whether the figures are current.
How OfferingStack builds demographic pages
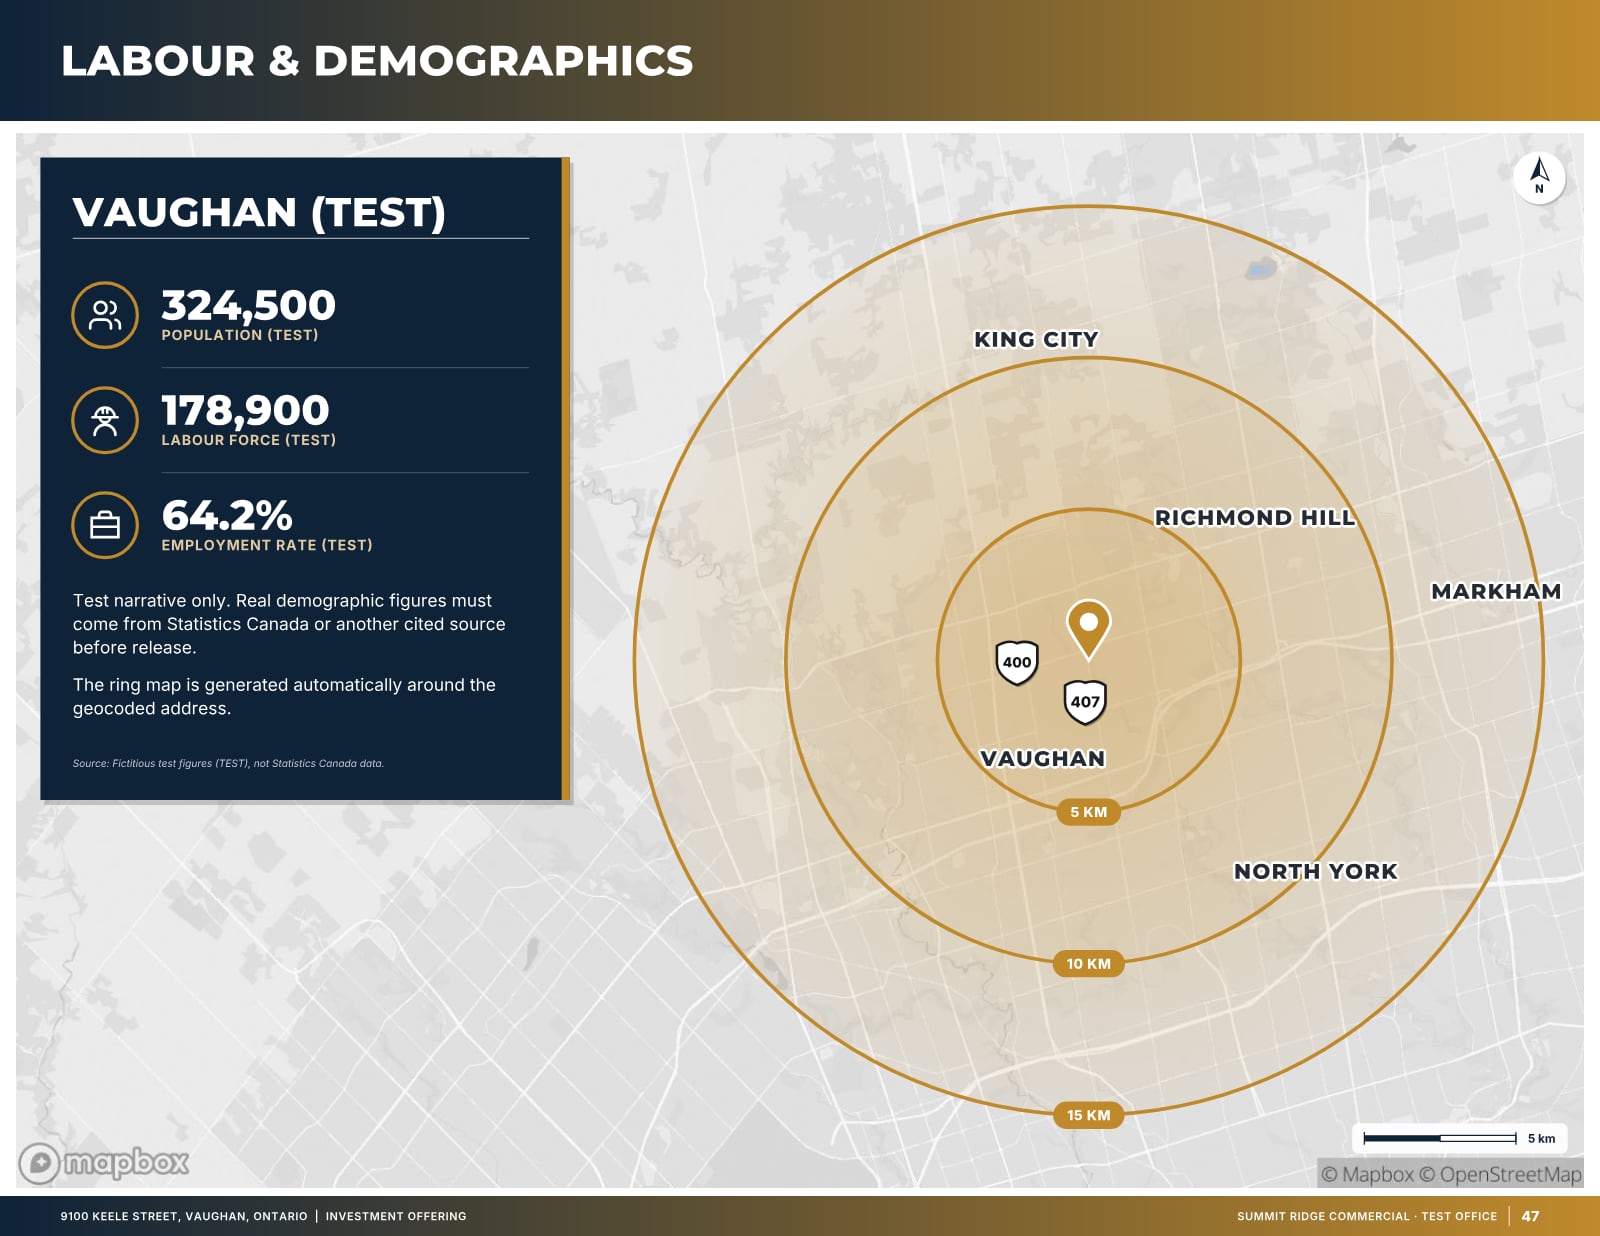
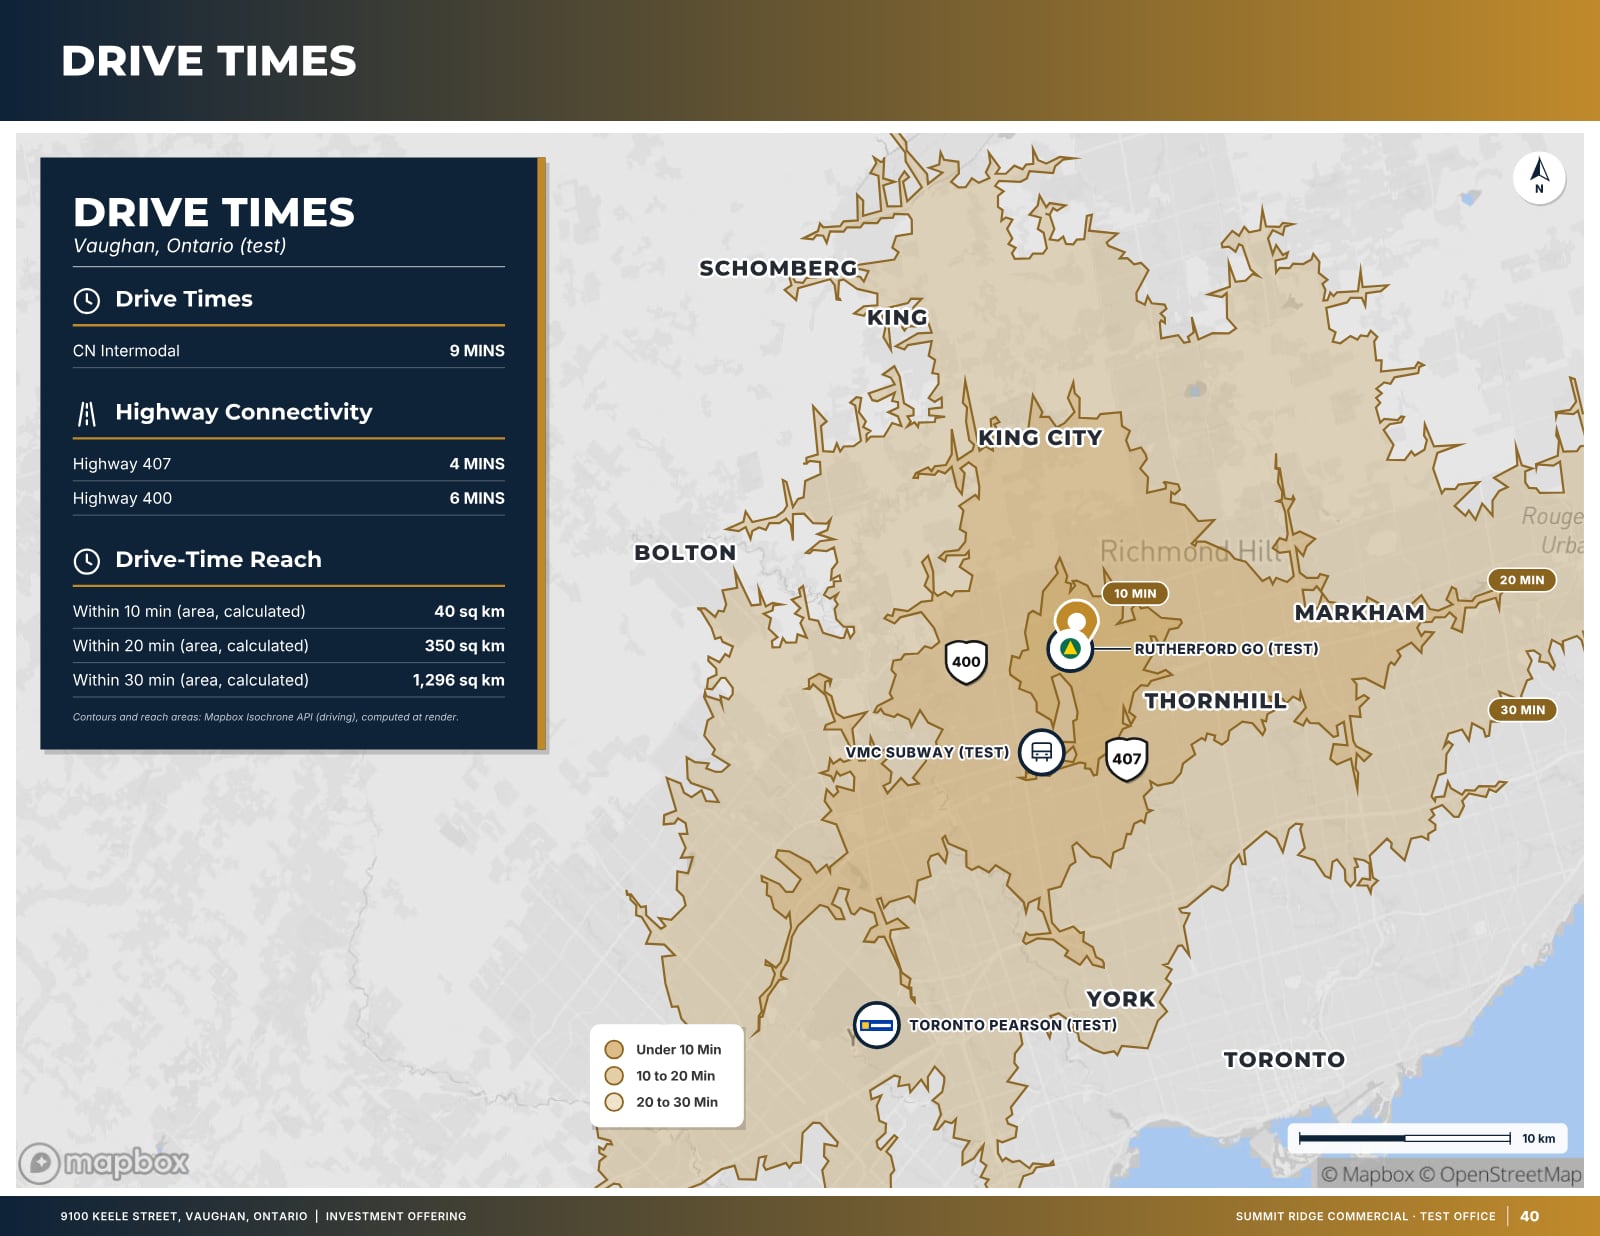
OfferingStack builds the location pages from the property address. For Canadian addresses it uses Statistics Canada 2021 Census data; for US addresses it uses U.S. Census Bureau American Community Survey 5-year estimates. Pages can show figures for 1, 3 and 5 km rings and labour within a drive-time area, and each figure carries its source and data year. If the data cannot be retrieved for an address, the section is left out instead of being filled with placeholder numbers. You review the pages, and can edit the text, before anything is published or sent.
What these pages look like
Sample pages are generated by the product from a fictitious test listing (9100 Keele Street, "Summit Ridge Commercial" test brand). Figures marked (test) are not real.
Related
Last updated 2026-10-14. General information for commercial real estate professionals, not legal advice.
Start with the fact sheet you already have.
Upload it, answer only what’s missing for the output you choose, and review a watermarked preview before you buy anything.