CRE marketing guide
Office building offering memorandums: tenancy, rollover and what buyers test
How to build an OM for an office investment sale: rent roll and stacking plan, lease rollover, leasing costs, building condition, transit and pricing.
Why office OMs need more than a rent roll
Office buildings carry more leasing risk than most commercial assets. Tenants are smaller and more numerous, leases are shorter, and every renewal or new lease comes with costs: tenant improvements, free rent and leasing commissions. A buyer is therefore underwriting not just today’s income but the cost of keeping the building leased over the hold, and the OM has to give them what they need to do it.
That means three things beyond the usual property and location pages: a clear picture of who occupies which floor and when each lease ends, the real cost of recent leasing, and the condition of the building systems that tenants will judge it on at renewal.
Tenancy: rent roll, stacking plan and tenant profiles
Start the tenancy section with a summary: occupancy on a stated date, the number of tenants, the largest tenants by area and income, and the weighted average lease term with its basis. Then give the detail.
- Rent roll: suite, tenant, rentable area, lease start and expiry, current net rent per square foot, scheduled rent steps, renewal and termination options, and the recovery structure for operating costs and taxes.
- Stacking plan: a floor-by-floor diagram of the building with each suite coloured by expiry year or status. It shows in seconds where vacancy sits and where large expiries cluster, which a table cannot.
- Tenant profiles for the major tenants: what the business does, how long it has been in the building, its lease entity and any guarantor, described from public or tenant-approved information.
- Vacant suites with their area, condition (shell, previous fit-out or model suite) and any leasing activity you are allowed to disclose.
Termination and contraction rights deserve their own line. A ten-year lease with a right to terminate after year five is underwritten by most buyers as a five-year lease, so flag it.
Rollover and the cost of leasing
An expiry profile showing the area and income expiring in each year is the core risk page of an office OM. Pair it with the facts behind the next few expiries: whether the tenant has given notice, is negotiating or has an option, and the rent at expiry compared with recent deals in the building.
Then show what leasing actually costs in this building. Recent leases with their term, net rent, free rent, tenant improvement allowance and commissions let a buyer estimate the net effective rent and the capital they will need for the next round of renewals. Disclose only what the leases and the landlord allow, and label any figures that are averages or estimates. Outstanding allowances and free rent still owed to tenants reduce what the buyer receives, so list them with amounts and dates.
Our free net effective rent and TI allowance calculators help check the arithmetic on individual deals; they are arithmetic only, not an appraisal.
The building: systems, condition and certifications
Tenants compare buildings on their systems, and buyers price the capital needed to keep them competitive. Give the facts you can confirm: year built and major renovations, floor plates, ceiling heights, the HVAC system and its age, elevators and their modernization dates, the electrical service, backup power, telecom providers, parking ratio and type, and accessibility features.
- Capital expenditure history for the last several years and known upcoming work, with amounts where available.
- The building condition report and any environmental reports, made available in the data room.
- Certifications such as LEED, BOMA BEST, ENERGY STAR, WELL or Fitwel with the program, level and year, checked against the program’s registry.
- Energy and water performance data the building reports, where it reports it.
Do not describe equipment as new or recently upgraded without the date. Buyers’ engineers will read the condition report, and a mismatch costs credibility everywhere else in the document.
Location: transit, amenities and the office market
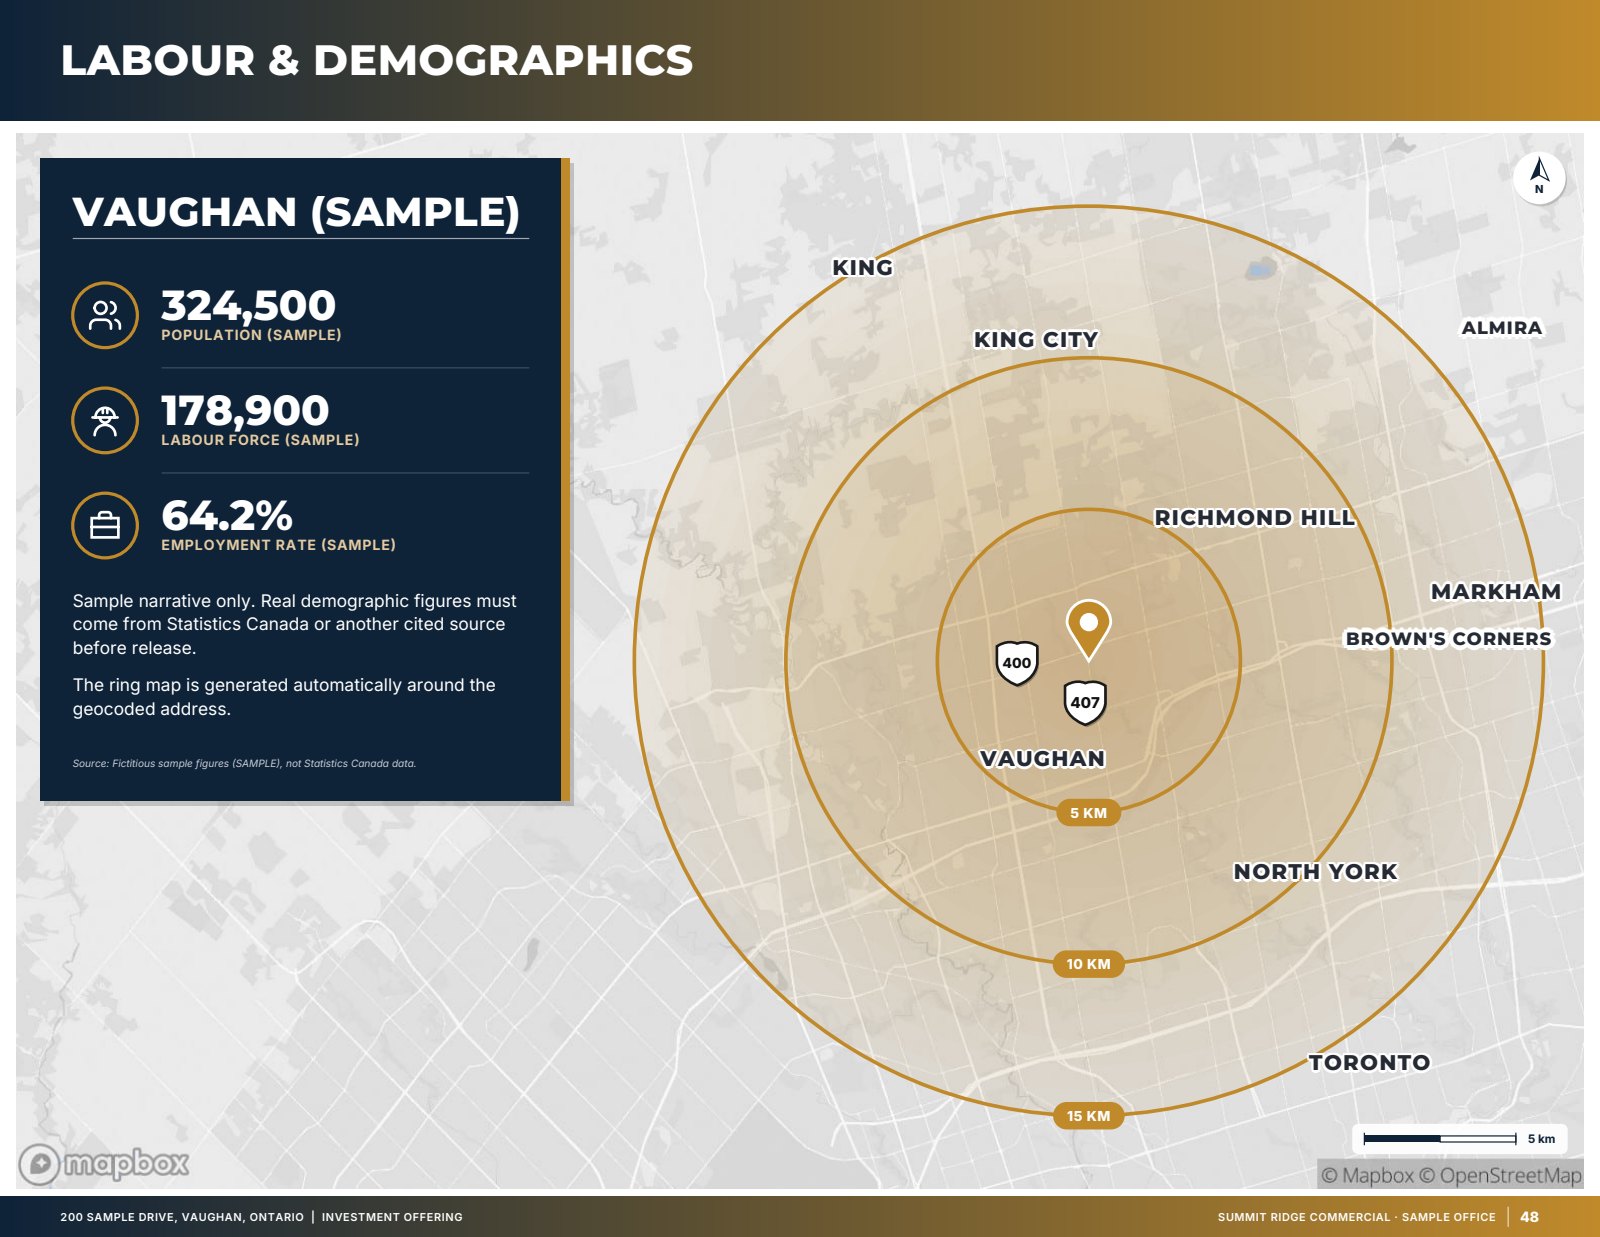
For office space, location is largely about how people get to work and what is around them when they arrive. Name the nearest transit stations and stops with measured walking times, show drive-time access for suburban buildings, and map the amenities office workers use: food, fitness, services, hotels and outdoor space. Add the labour force and population around the building from official census sources, each with its year.
Buyers also want context on the local office market: competing buildings, their vacancy if published, and recent sales and leases. Quote market reports and comparables with their source and date, and keep any forward-looking statement clearly labelled as someone’s forecast rather than a fact.
Financials and pricing
Office operating statements need careful presentation because recoveries, gross and semi-gross leases, and vacancy all interact. Show base rent, recoveries, parking and other income, vacancy and credit loss, operating costs and taxes, and NOI, with in-place and pro forma columns labelled and dated. If you show a multi-year cash flow, list its assumptions on the same page: market rent, renewal probability, downtime, free rent, tenant improvements, leasing commissions and capital reserves.
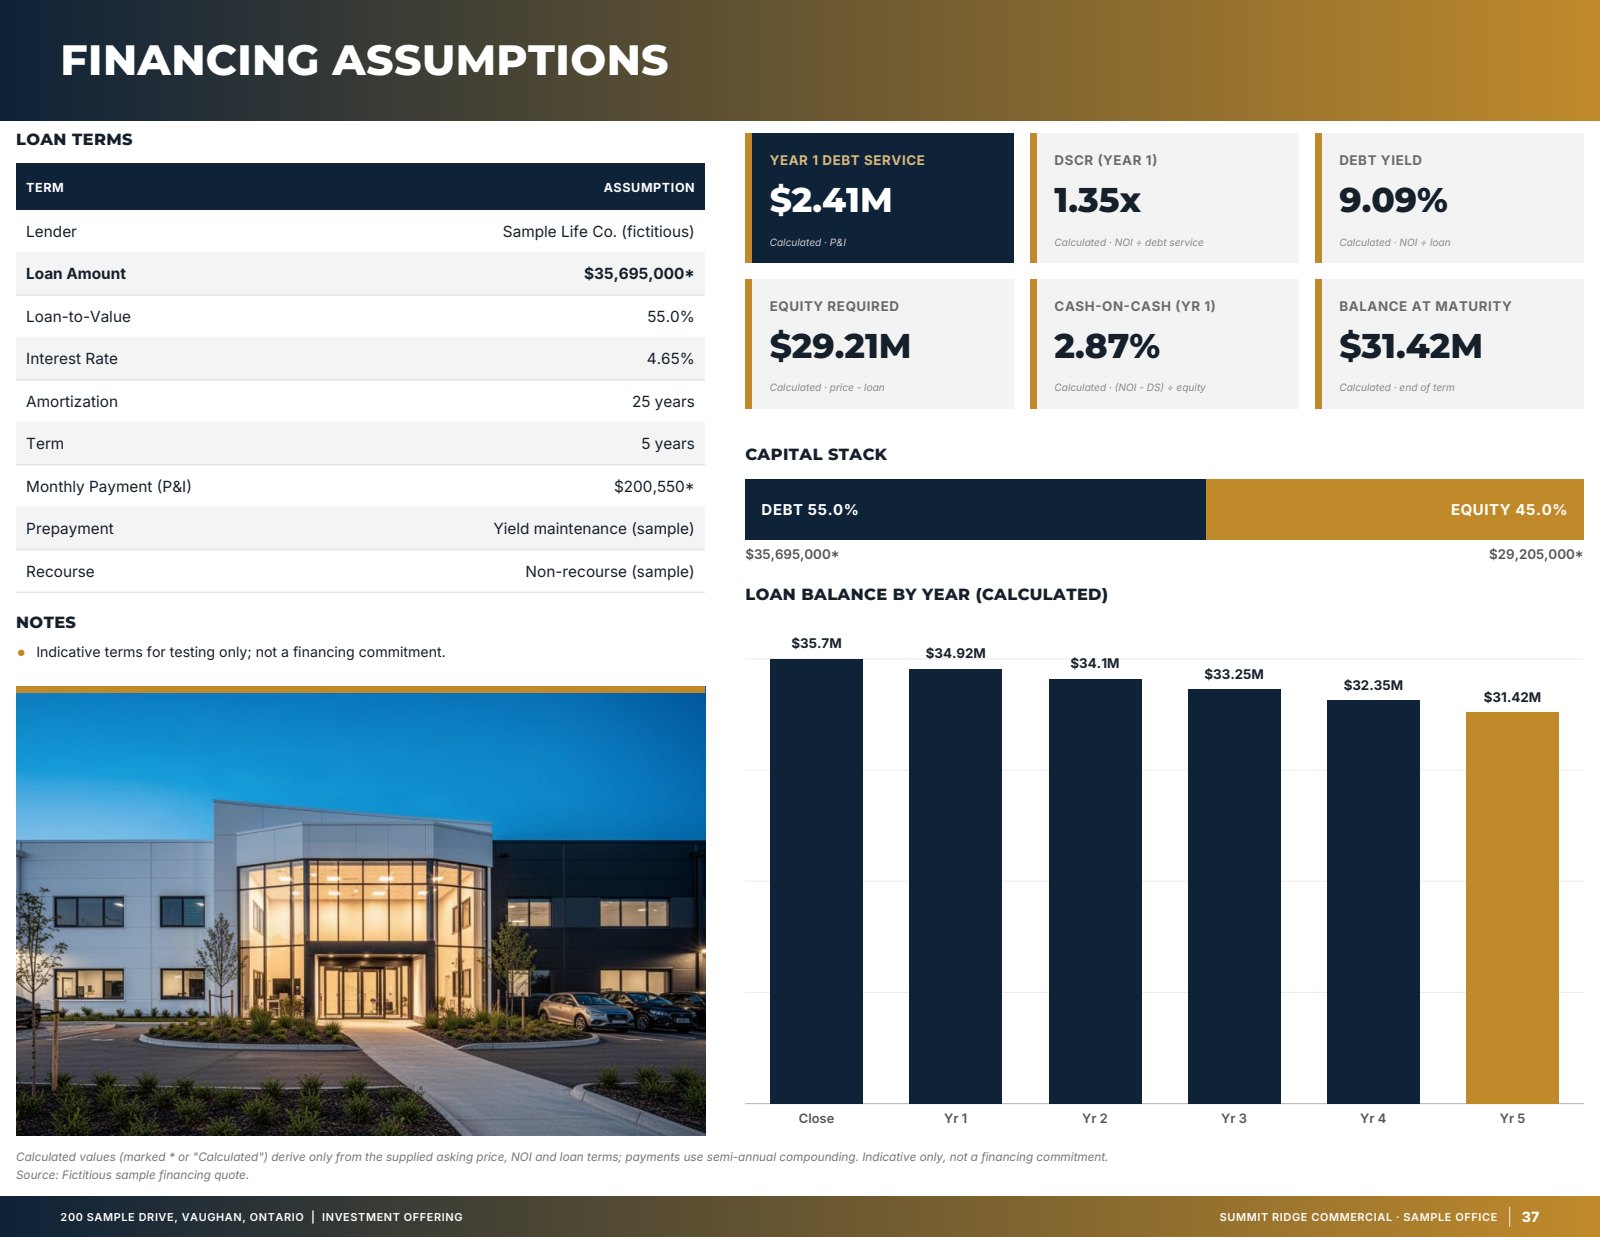
Quote the cap rate on a stated year’s NOI, price per square foot on the rentable area, and any financing figures as illustrative unless a lender has committed. Sale comparables of similar buildings, each with its date, size, occupancy and source, support the price.
Canada and the United States
Canadian office listings usually quote net rent plus additional rent or TMI, measure under a BOMA standard named with its edition, and cite census figures from Statistics Canada. US listings use the same BOMA standards but more often quote full-service gross rents with an expense stop or base year in some markets, and cite the American Community Survey. State the rent basis next to every rent figure so readers on either side of the border compare like with like.
How OfferingStack builds an office OM
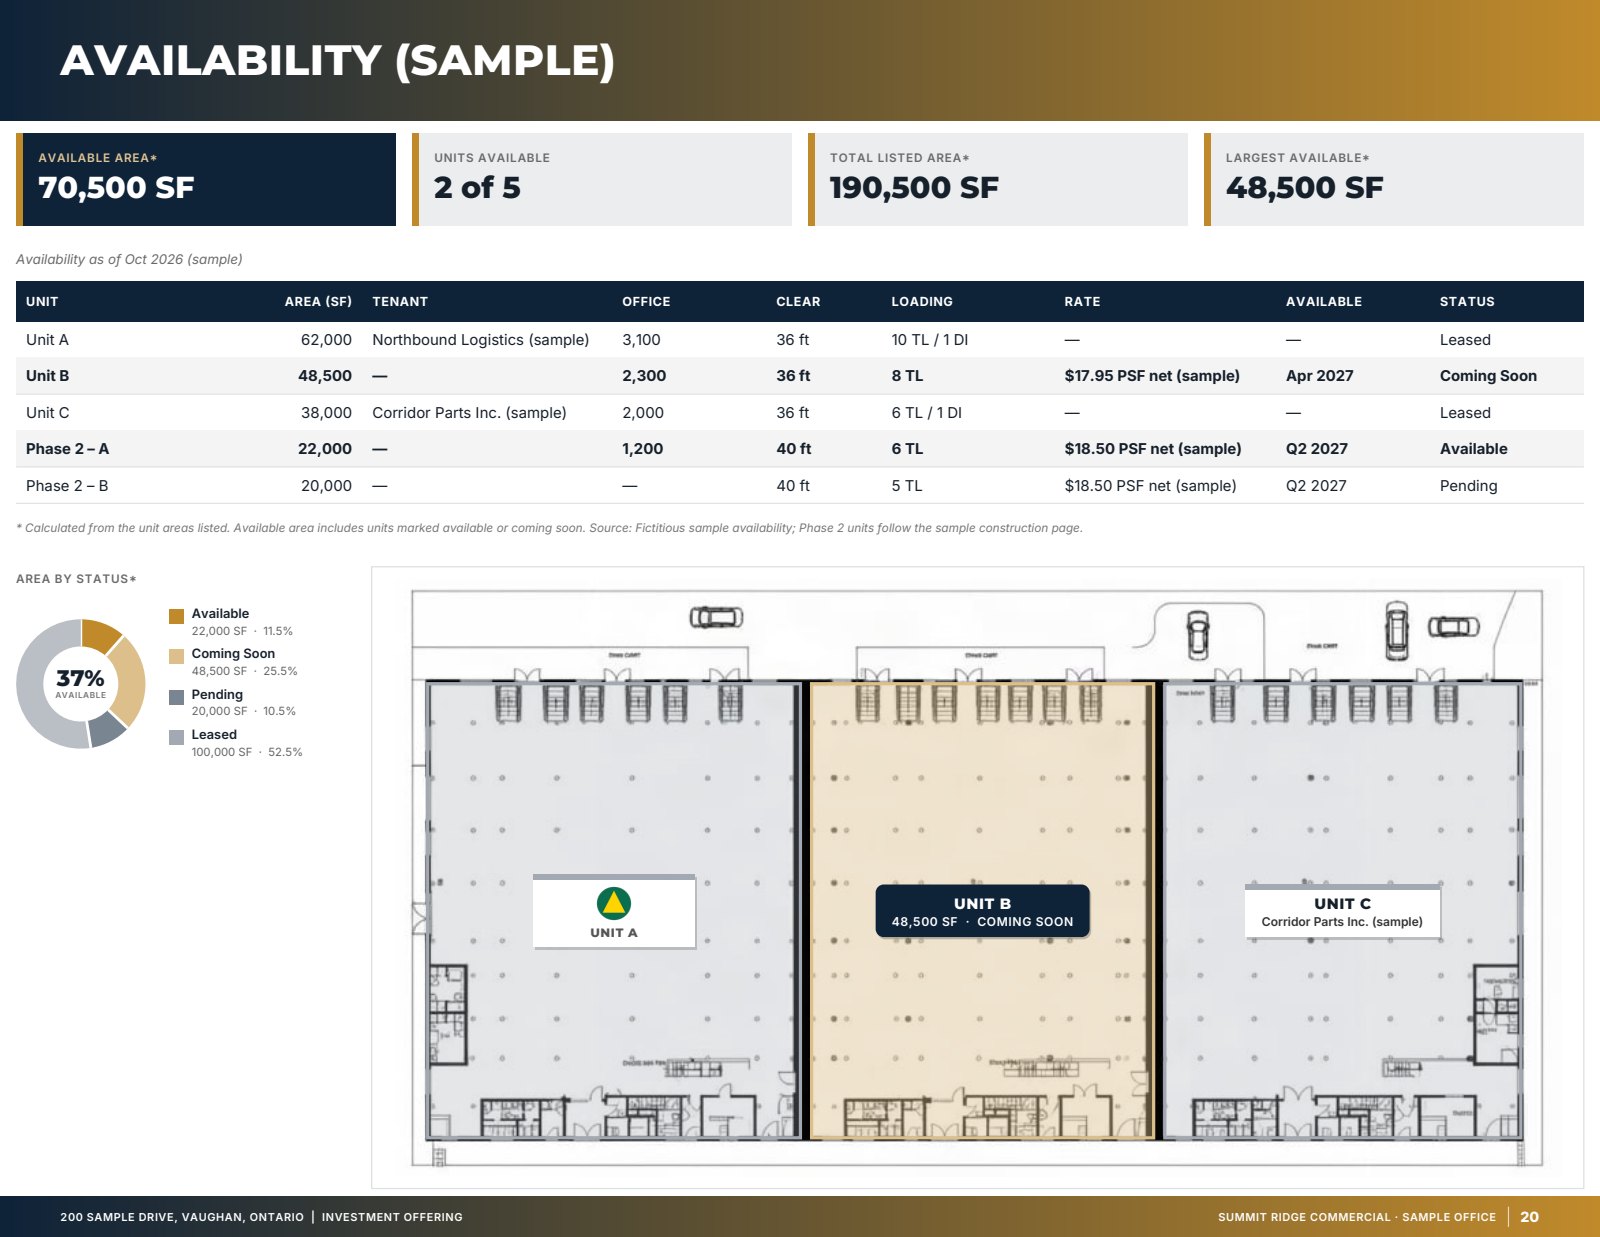
OfferingStack lays out the pages from the facts you enter. A for-sale listing with price and income gets an investment summary with NOI, cap rate, occupancy and WALT, calculated values labelled. The tenancy page carries the rent roll, a rent roll chart shows income and expiries by tenant, a stacking plan shows the suites on each floor, and tenant profiles and lease abstracts follow. Floor plans, availability and leasing plans by floor, building specifications, sustainability, capital expenditures, a 10-year cash flow and financing pages appear when you have the data. Location pages include transit and connectivity, amenities and labour and demographics from sourced data, and market and comparables pages come from what you add. Pages without data are left out, and you review every page before it goes out.
Checklist for an office OM
- Occupancy date, WALT basis and the largest tenants summarized up front.
- Rent roll with options and termination rights flagged; stacking plan by expiry year.
- Expiry profile and the status of the next several expiries.
- Recent leasing costs: free rent, TI allowances and commissions, as disclosed.
- Outstanding allowances and free rent listed with amounts and dates.
- Building systems, capital history and certifications with dates and sources.
- Transit with measured walking times, amenities and census figures with years.
- Operating statement and any cash flow with assumptions on the same page.
This guide is general information, not legal, tax or appraisal advice. A licensed professional should review the OM before release.
What these pages look like
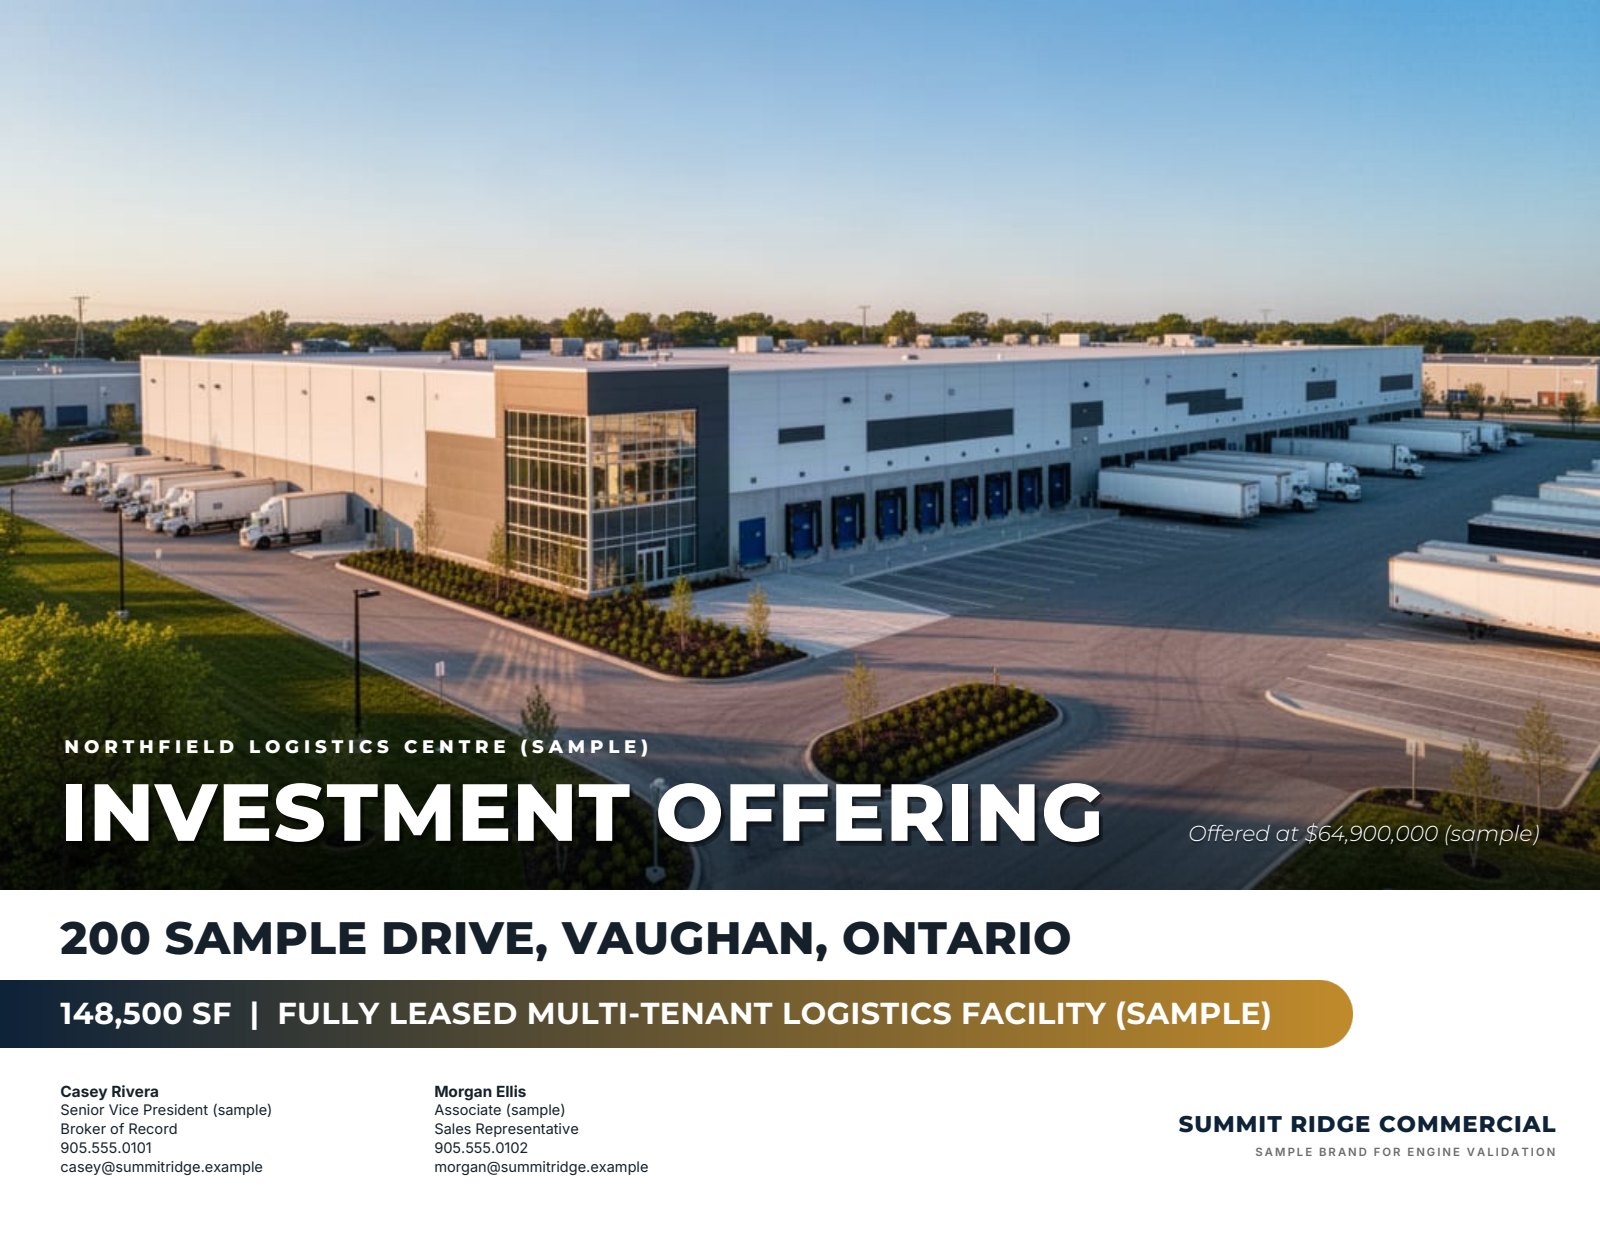
Sample — fictitious property. Pages generated by the product for an invented sample listing with an invented brokerage brand. Figures marked (sample) are not real.
Related
Last updated 2026-10-15. General information for commercial real estate professionals, not legal advice.
Start with the fact sheet you already have.
Upload it, answer only what’s missing for the output you choose, and review a watermarked preview before you buy anything.