CRE marketing guide
Retail plaza and shopping centre offering memorandums: what buyers check
What a retail plaza or shopping centre OM needs: tenant mix, anchors, co-tenancy, recoveries, trade area, traffic counts, site plan and pricing.
Why retail OMs are read differently
A buyer of an industrial building is mostly buying the building and its lease. A buyer of a retail plaza is buying a group of businesses that depend on each other and on the shoppers around them. The rent roll matters, but so do the questions behind it: which tenants bring people to the centre, whether the smaller tenants can keep paying their rent, how much of the operating cost is recovered, and whether the trade area can support the mix over the hold period.
That changes how the offering memorandum should be organized. The tenancy section moves to the front, the site plan becomes a working document rather than a picture, and the location pages need figures a retail analyst can use: households and population within set distances, traffic past the site and the competing centres nearby.
Start with the tenant mix
Lead the tenancy section with a summary a buyer can absorb in a minute, then the detail behind it.
- Anchors and major tenants: who they are, their area, their remaining term and options, and whether they own or lease their premises. A pad or a store owned by the retailer is part of the centre’s draw but not part of the income being sold, so show it on the site plan and say so.
- Tenant categories: grocery, pharmacy, restaurants and quick service, personal services, medical and dental, fitness, financial, discount and general retail. Buyers look for a mix that is needed rather than optional, and for how much income depends on any one category.
- National, regional and local tenants: describe each tenant accurately as it appears on the lease, including the tenant entity and any guarantor, rather than the brand on the sign.
- Vacancy: list every vacant unit with its area and frontage, and how long it has been vacant if you know. Buyers will find it on the tour anyway.
A rent roll chart that shows the share of income and area by tenant, and the expiry year of each lease, does this at a glance. Keep the full rent roll behind it, unit by unit.
Lease terms that move value in retail
Retail leases carry clauses that office and industrial leases rarely do, and several of them change what the income is worth. A buyer’s lawyer will read the leases, but the OM should flag the ones that matter so nobody is surprised.
- Co-tenancy: a clause that lets a tenant pay reduced rent or leave if an anchor closes or the centre’s occupancy falls below a level. Say which leases have one and what triggers it.
- Exclusive use: a promise that the landlord will not lease to a competing use. Exclusives limit who can fill a vacancy, so list them.
- Radius restrictions: a limit on the tenant opening another location nearby, which protects sales at this centre.
- Percentage rent: rent based on the tenant’s sales above a breakpoint. If it is paid, show the history; if sales are not reported, say so.
- Go-dark and early termination rights, relocation rights, and any rights of first refusal or offer on the property or a pad.
- Recoveries: whether each tenant pays its share of common area maintenance, taxes and insurance, any caps on increases, administration fees, and gross or semi-gross leases where the landlord carries costs.
Put these in the lease abstracts, one per significant tenant, with the rent schedule from closing to expiry and each renewal option shown separately at its stated rent.
Income, recoveries and pricing
Retail operating statements often show large recovery income against large operating costs, which makes reconciliation the first thing an analyst checks. Show the base rent from the rent roll, the recoveries billed under the leases, percentage rent if any, and other income such as parking, signage or telecom licences, then the operating costs and property taxes, and NOI.
- State the recovery ratio basis (recoveries ÷ recoverable costs) and explain any shortfall: vacancy, caps, gross leases or non-recoverable items.
- Keep in-place and pro forma columns separate, and if the pro forma assumes vacancies are leased, state the rent, the downtime and the costs of leasing them.
- Quote the cap rate on a stated year’s NOI, and price per square foot on the gross leasable area (GLA), not the land or the gross building area.
- For a centre with a mortgage that can be assumed, give the balance, rate, maturity and amortization.
Allowances still owing to tenants, free rent still to run and amortized improvements built into current rents all affect the income a buyer receives, so list them with their amounts and dates. Our tenant improvement allowance calculator shows how an amortized build-out translates into rent per square foot.
The trade area: who shops here
Retail buyers think in trade areas: the population, households and spending within a short drive or walk, and how that is changing. Present it as figures they can compare with other centres.
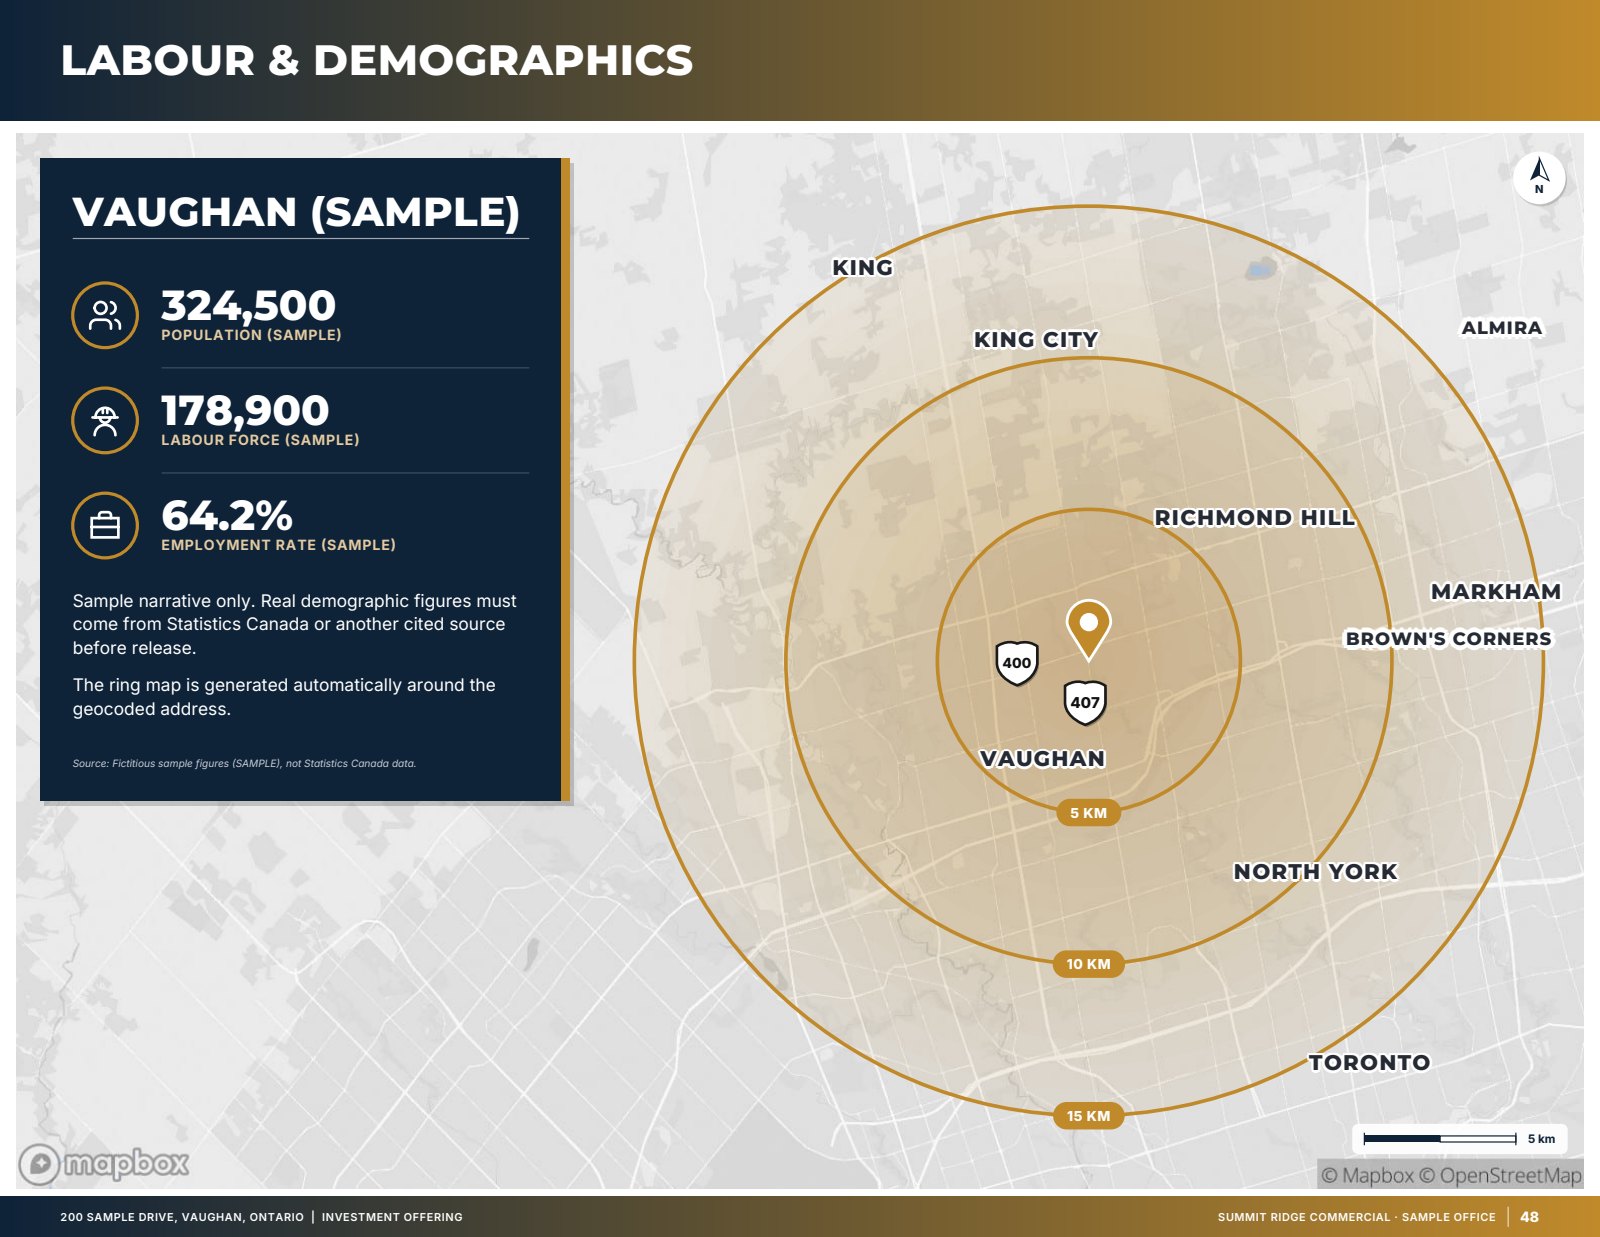
- Population and households within set rings, commonly 1, 3 and 5 km in Canada or 1, 3 and 5 miles in the United States, or within drive-time areas, each figure with its source and census year.
- Household income and household size where the census reports them, with the same year and geography as the population.
- Daytime population or nearby employment for centres that depend on lunch and errand trade.
- Residential projects under construction or approved nearby, described with their source and status, not as certainties.
Use official sources (Statistics Canada census profiles in Canada, the US Census Bureau’s American Community Survey in the United States), date every figure and never mix years in one table without saying so. A projection belongs in a separately labelled row with its source.
Traffic, access and visibility
Traffic past the site is one of the first numbers retail tenants ask for, and buyers use it to judge how easily the centre can be re-leased. Quote official counts, usually annual average daily traffic (AADT), from the provincial, municipal or state transportation programme that published them, with the road segment and the year. Counts are published for some roads and not others and are often several years old; say which year you are quoting and do not round up.
Describe access in practical terms: the number of entrances from each road, signalized intersections, turning movements, pylon and fascia signage, and the parking supply. A site plan with the entrances, pylons and parking marked answers most of these questions faster than text.
The site plan and the leasing plan
For a retail plaza the site plan is the document buyers and tenants use most. Show every unit with its number, tenant name and area, colour the vacancies, mark pads and any retailer-owned parcels, and label the roads, entrances and pylons. Use the same unit numbers and areas as the rent roll; a mismatch between the two is one of the most common errors in retail OMs.
If the centre has several buildings or floors, a leasing plan for each lets a reader see exactly where the vacancies are and how they could be combined.
Competition and comparables
Map the competing centres within the trade area and describe each one briefly: its anchors, its size and whether it has vacancy. Then show sale comparables for similar centres, with price, GLA, price per square foot, occupancy and cap rate where the source reports it, and lease comparables for the unit sizes you are trying to fill. Note the source and date for each comparable and leave a figure out rather than estimate it.
Canada and the United States
The structure of a retail OM is the same on both sides of the border, but the vocabulary and the data sources differ. Canadian listings usually say plaza or shopping centre, quote areas in square feet with metric equivalents on surveys, describe recoveries as TMI or additional rent and use Statistics Canada figures in kilometre rings. US listings more often say strip center or shopping center, use CAM for common area charges and NNN for the lease structure, and use American Community Survey figures in mile rings. Write for the buyer pool you expect, and define any term that might be read differently.
How OfferingStack builds a retail OM
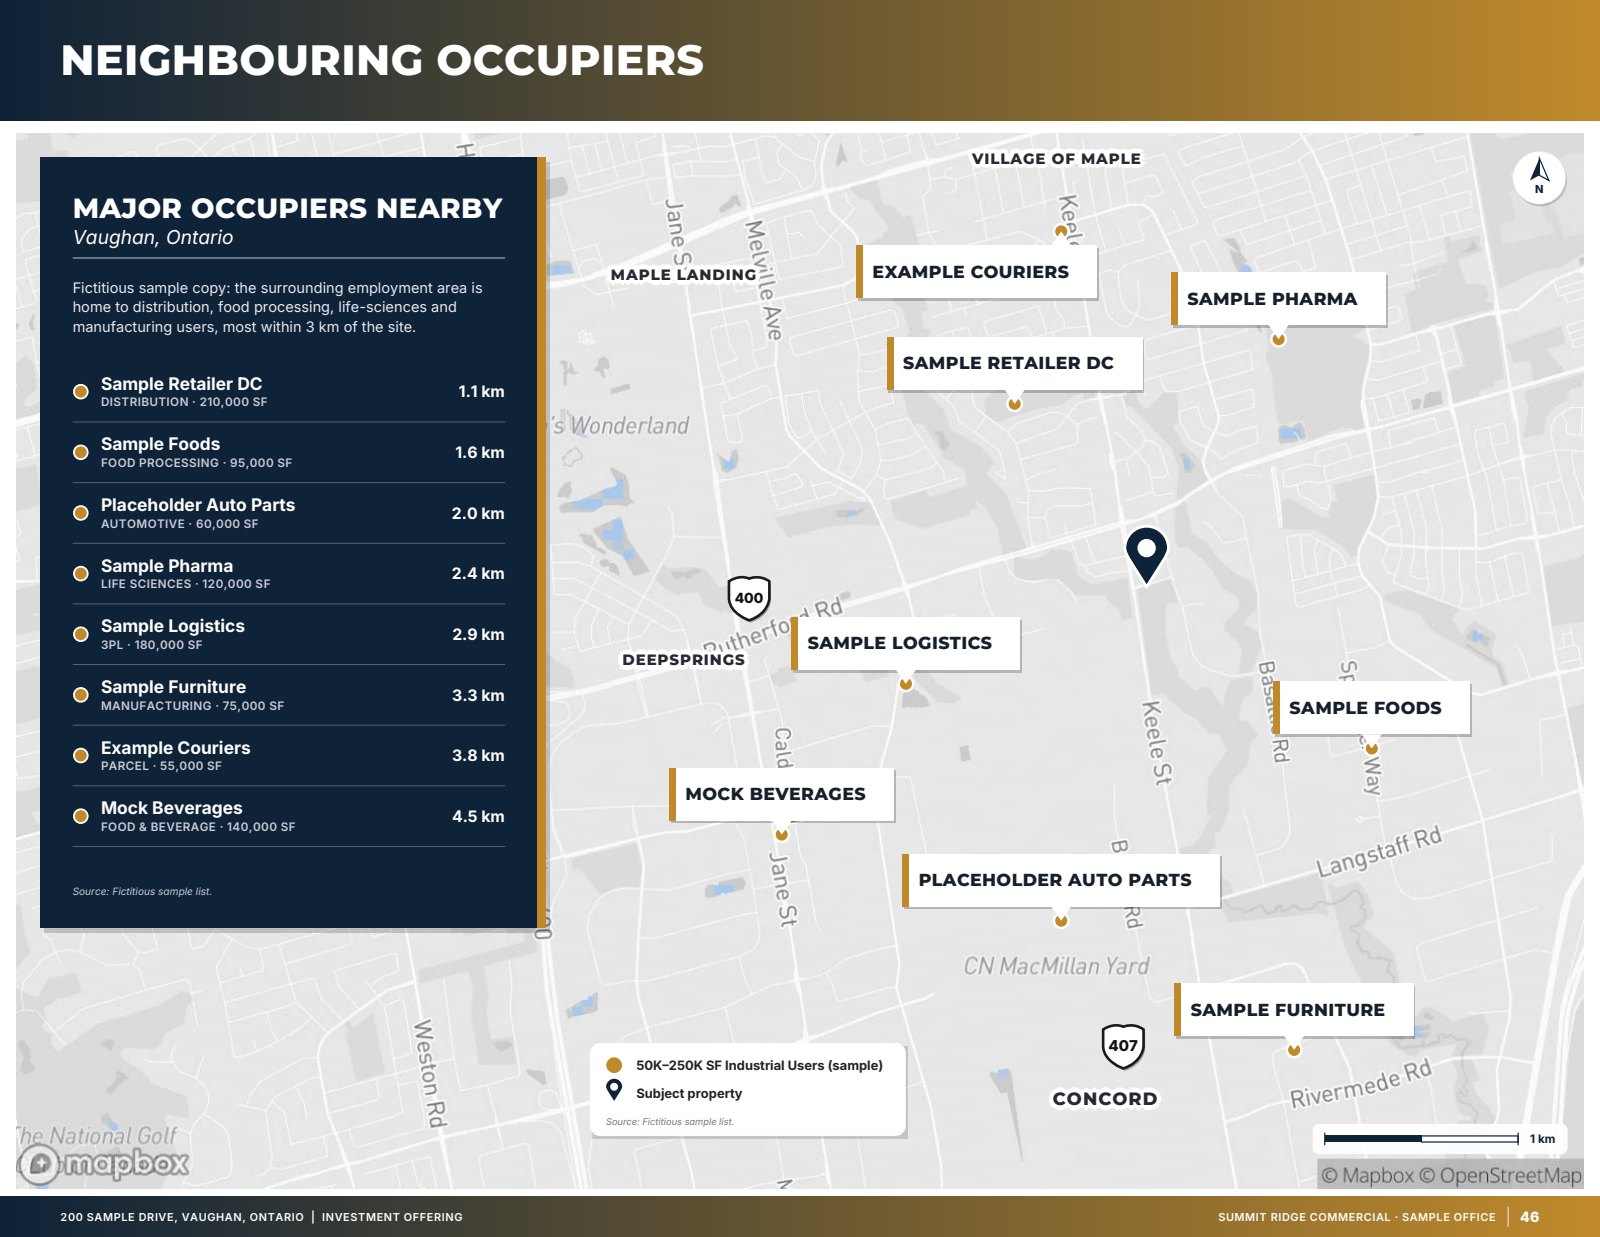
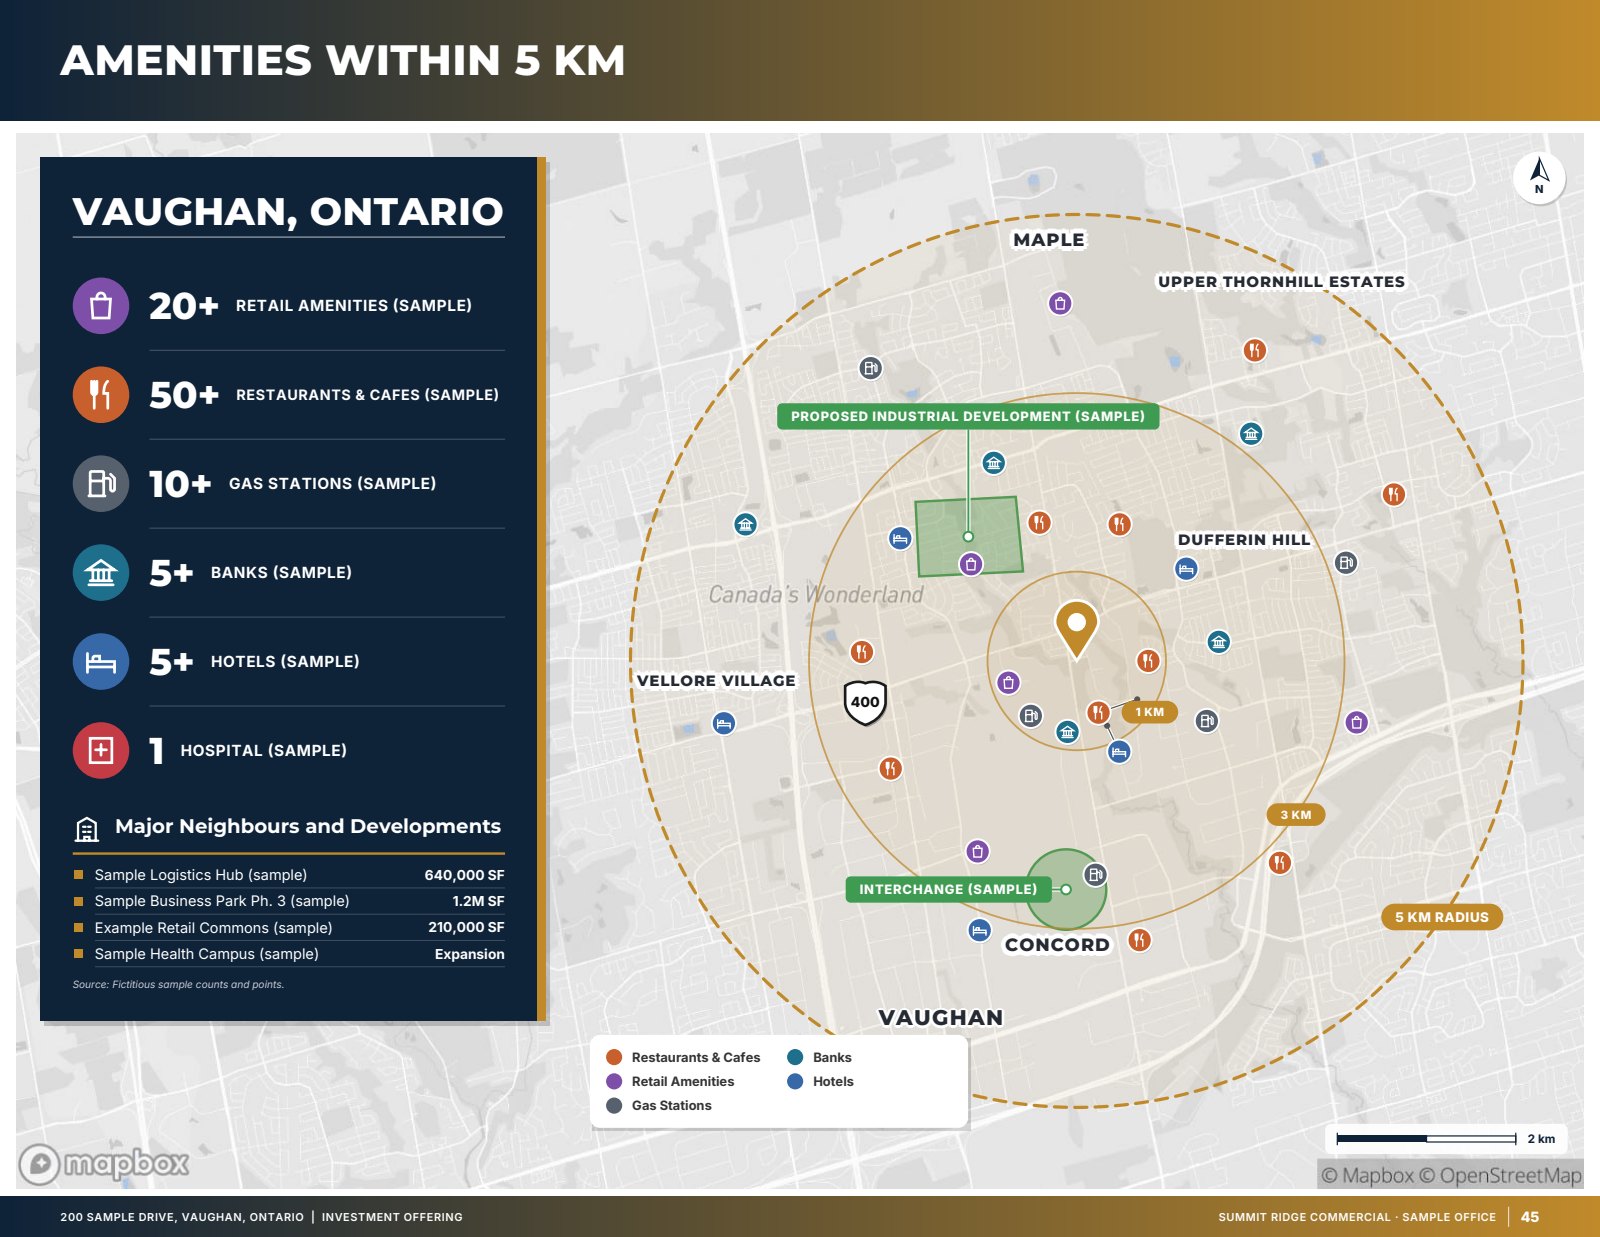
OfferingStack lays out the pages from the facts you enter: a tenancy page from the rent roll, a rent roll chart with income and expiries by tenant for a sale, tenant profiles, a lease abstract page per tenant with its terms and rent schedule, an availability and leasing plan with unit outlines, the site plan, and location pages with an amenities map, a neighbouring occupiers map and drive times. A location refresh adds a trade area table (1, 3 and 5 km rings from Statistics Canada in Canada, or American Community Survey block groups in the United States) and official traffic counts where a programme publishes them, rounded down and dated with their source. Comparables pages and an on-the-market page come from the comps you add. Pages without data are left out, and you review every page before the document is distributed.
Checklist for a retail plaza OM
- Tenant mix summary: anchors, categories, share of income, vacancy.
- Rent roll with unit numbers and areas that match the site plan.
- Lease abstracts with co-tenancy, exclusives, percentage rent, options and recoveries flagged.
- Operating statement with recoveries reconciled to recoverable costs.
- Outstanding allowances, free rent and amortized improvements listed.
- Trade area figures with source and year; traffic counts with road segment and year.
- Site plan with entrances, pylons, parking, pads and retailer-owned parcels.
- Competing centres and sale and lease comparables, each with source and date.
This guide is general information, not legal, tax or appraisal advice. Have the leases reviewed by a lawyer and the OM reviewed by a licensed professional before release.
What these pages look like
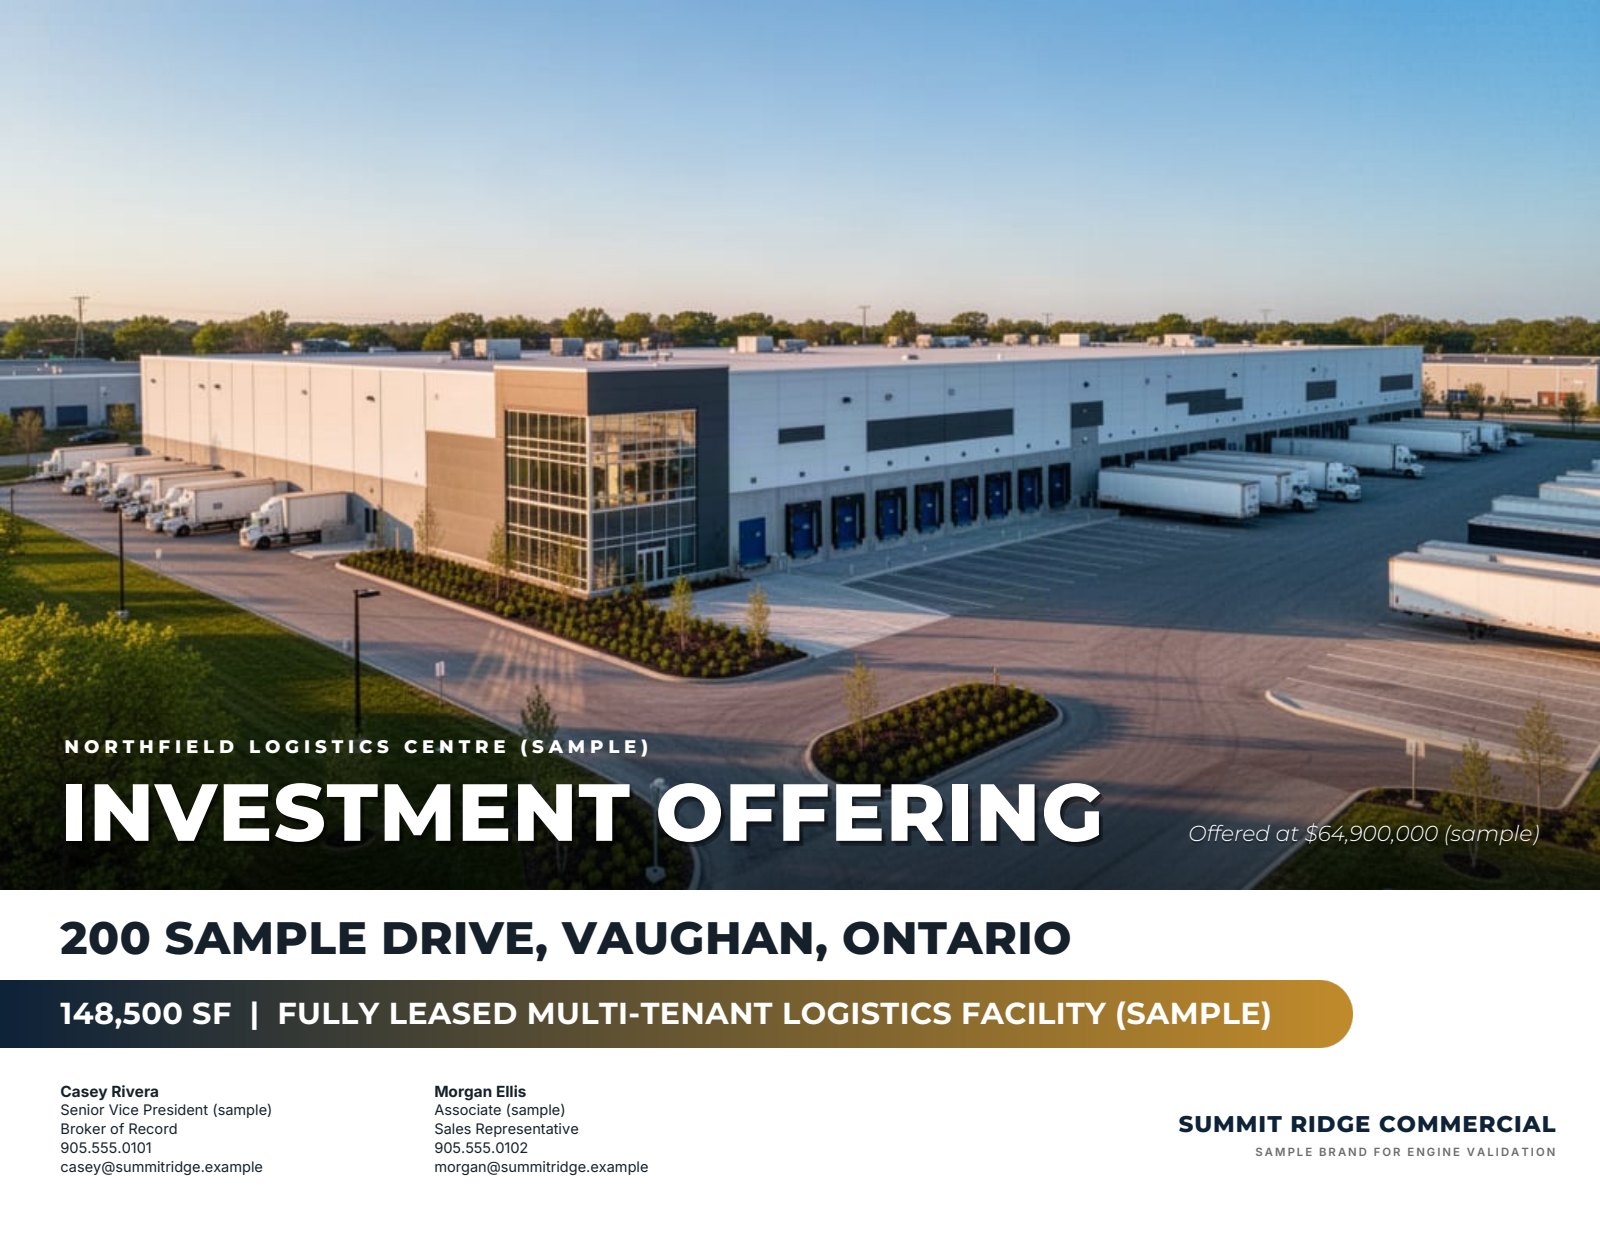
Sample — fictitious property. Pages generated by the product for an invented sample listing with an invented brokerage brand. Figures marked (sample) are not real.
Related
Last updated 2026-10-15. General information for commercial real estate professionals, not legal advice.
Start with the fact sheet you already have.
Upload it, answer only what’s missing for the output you choose, and review a watermarked preview before you buy anything.