CRE marketing guide
The cash flow projection in an offering memorandum: how to present a 5- or 10-year pro forma
How to lay out a multi-year cash flow in an OM: the line items, the assumptions page, how to separate in-place from projected, and what buyers check.
What the cash flow page is for
The operating statement shows what a property earned and spent. The cash flow projection shows what the listing broker or vendor expects it to earn over the next five or ten years if the stated assumptions hold. It is the page that turns a rent roll into a view of the future: leases expiring, rents stepping up, vacancy being filled or lost, and capital spent along the way.
Most institutional and larger private buyers will rebuild the projection in their own model, so its job in the OM is not to replace their underwriting. Its job is to show the vendor’s view clearly enough that a buyer can see where it agrees, where it disagrees, and what the difference is worth. A projection that is easy to check earns more trust than one that is merely optimistic.
Five years or ten?
Ten-year projections are common for office, retail and multi-tenant industrial properties where buyers model several lease cycles, and they match the hold period many institutional buyers use. Five years is often enough for smaller properties, single-tenant assets with a long remaining lease, apartment buildings with stable rents, and listings aimed at private buyers. Whatever the length, use the same years in the cash flow, the rent roll analysis and any return figures, and start the first year on a stated date rather than “Year 1” alone.
The line items, in order
Buyers expect a familiar order, so they can find each line without reading the labels twice:
- Potential base rent: in-place rents from the rent roll, steps as the leases set them, and market rent for vacant or expiring space after an assumed downtime.
- Expense recoveries or additional rent, for net leases.
- Other income: parking, storage, signage, laundry, antenna or rooftop licences.
- Vacancy and credit loss, shown as its own line, not netted into rent.
- Effective gross income as a subtotal.
- Operating expenses, by category or as one line with the categories on the operating statement page.
- Net operating income.
- Below the line: tenant improvements, leasing commissions and capital reserves or projects.
- Cash flow before debt service, and, if a financing page is included, cash flow after debt service.
Show expenses and capital as negative figures in brackets, and keep subtotals visually distinct. Round to whole dollars or thousands consistently; cents in a ten-year projection suggest a precision nobody has.
The assumptions are the real content
Every number after year one is an assumption, so put the assumptions on the page or the facing page, in plain words, short enough to read in a minute:
- Start date and the rent roll date the projection is built from.
- Market rent for each space type, its growth rate, and the basis (net or gross, per square foot per year).
- Renewal probability, downtime between tenants, and free rent on new leases.
- Tenant improvements and leasing commissions for new and renewing tenants.
- General vacancy and credit loss.
- Expense growth, and property tax assumptions where a sale may trigger a reassessment.
- Capital projects and reserves, by year.
Where a figure comes from a source, name it: an appraisal, a leasing broker’s opinion of market rent, the vendor’s budget. Where it is the preparer’s judgement, say so. Never present a projected rent as if it were a signed lease.
Separate in-place from projected
The most common complaint buyers have about OM cash flows is that the first year already includes things that have not happened: a vacant suite leased at market rent, a rent increase not yet agreed, expenses lower than the actuals. Keep the first year honest. If the vendor expects a lease to be signed, show it from its expected start with the assumption stated, or show two cases: in-place and stabilized.
The same applies to pricing. If the asking price is based on stabilized net operating income, the OM should say so next to the price and show the in-place figure as well. Buyers will work it out anyway; saying it first protects the broker’s credibility.
Showing the projection visually
A table of ten columns and fifteen rows is hard to read on its own. A simple chart above the table helps the reader see the shape of the projection: net operating income as bars, cash flow as a line, so dips from lease expiries and capital spending stand out. Two or three summary figures next to the chart, such as the growth rate of net operating income over the period and the cumulative figures, give the headline without hiding the detail. Label every summary figure as calculated and show the years it covers.
Returns, debt and what not to promise
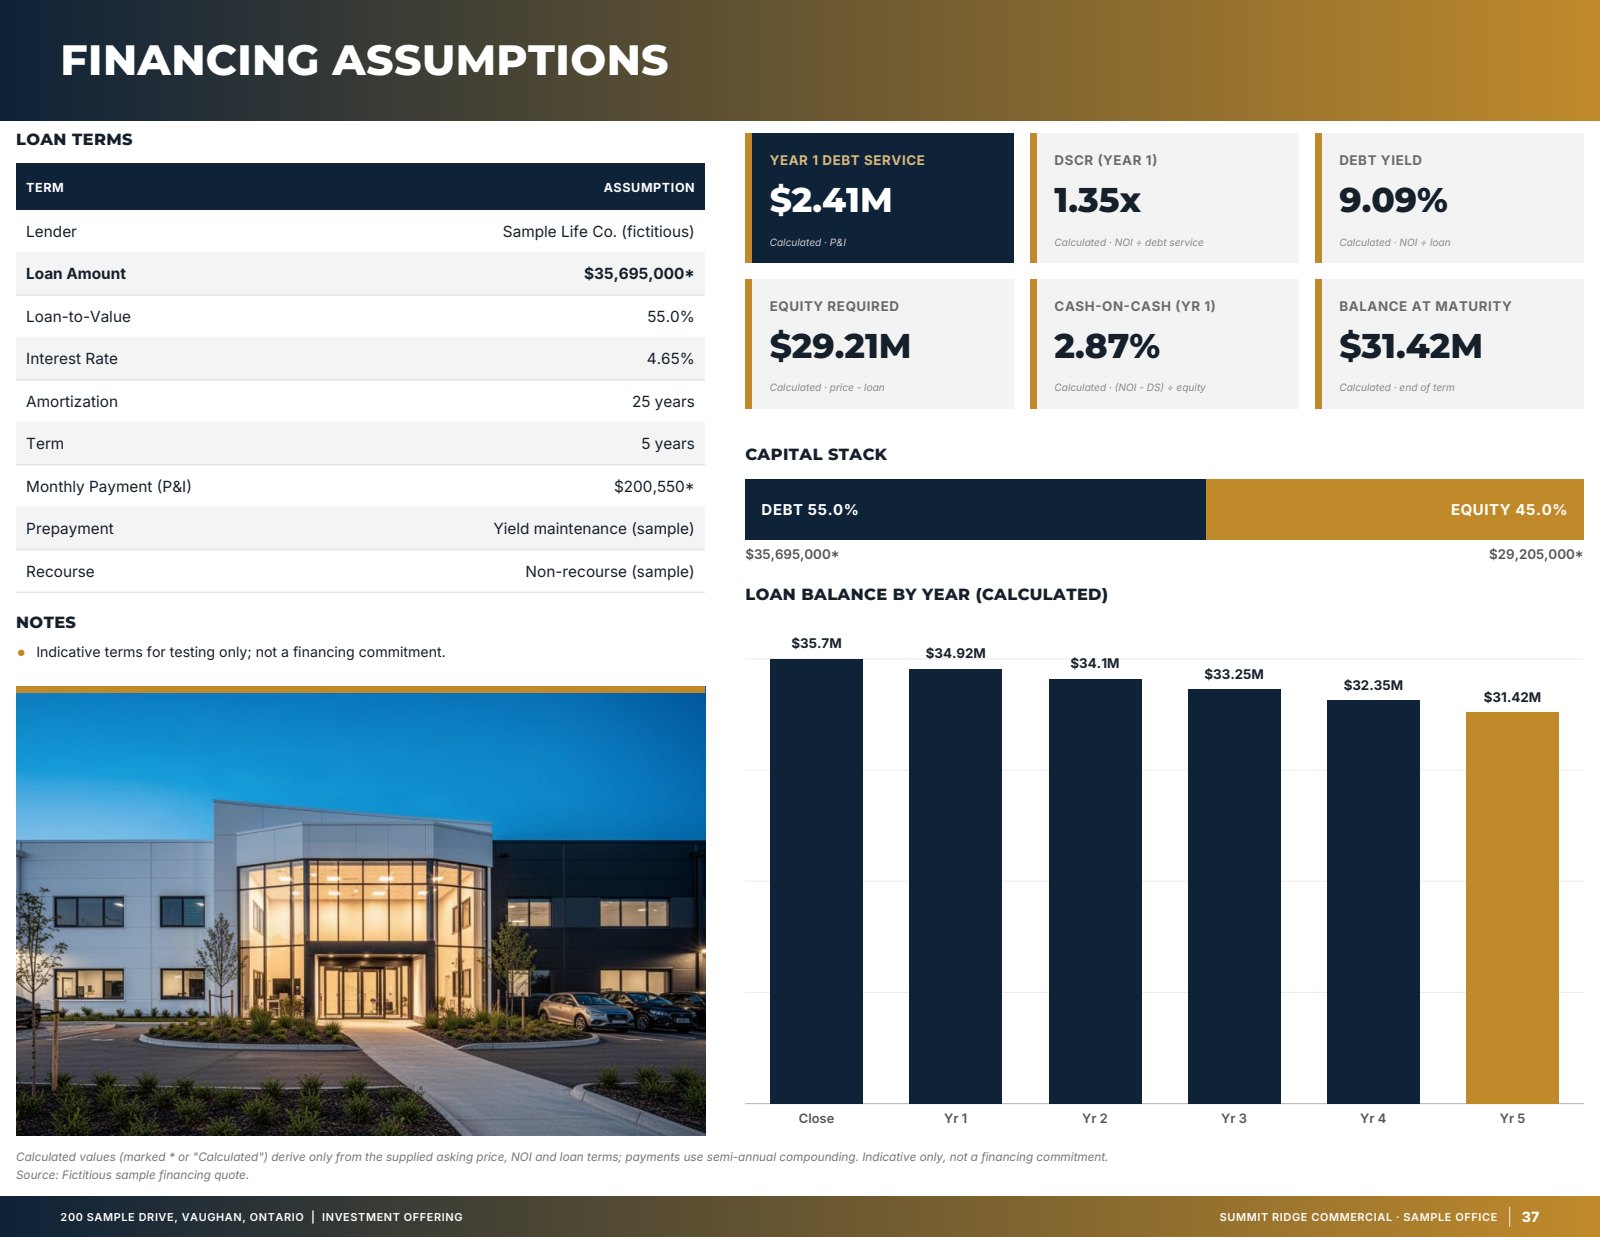
Many OMs stop at unlevered cash flow and let buyers apply their own financing and exit assumptions. If you do show returns, such as an internal rate of return, an equity multiple or a cash-on-cash yield, show every input: purchase price, closing costs, the exit year and exit cap rate, and the loan terms if the figures are levered. A return figure without its inputs is a sales line, not analysis.
Do not describe projected returns as expected, likely or guaranteed. Projections are estimates prepared for marketing; the buyer must rely on their own investigation. Your brokerage’s approved disclaimer should cover the cash flow page explicitly, and in some jurisdictions there are rules about how forward-looking figures may be presented to buyers. Check with your brokerage or regulator.
Canada and the United States
The structure is the same on both sides of the border, but the vocabulary differs. Canadian OMs often refer to additional rent or TMI (taxes, maintenance and insurance) where US documents say NNN or expense reimbursements. Areas may be quoted in square feet or square metres in Canada; state the unit once and keep it. Show the currency on the page, particularly when the document may reach cross-border buyers, and do not mix fiscal years and calendar years in the same projection.
Adding a cash flow page with OfferingStack
OfferingStack does not build the projection for you: the figures come from your own model or the vendor’s. In the builder you enter the columns (from two to eleven, such as years or an in-place column followed by projected years) and up to eighteen lines, each marked as income, expense, subtotal, net operating income, capital or cash flow. Expense and capital lines print in brackets, and the net operating income and cash flow lines print as totals.
When the table has a net operating income line, the page draws net operating income as bars and cash flow as a line, with summary tiles for the growth rate of net operating income and the cumulative figures, each labelled as calculated with the years it covers. Up to six assumptions print under the table, and a source line at the foot of the page. The page only appears when it has lines to show, and you review it before the offering memorandum is sent.
Cash flow page checklist
- Start date and rent roll date stated.
- Lines in the expected order, with vacancy shown separately.
- Expenses and capital in brackets; consistent rounding.
- In-place and projected clearly separated, especially in year one.
- Assumptions listed in plain words, with sources where they exist.
- Same years as the rent roll analysis and any return figures.
- Returns, if shown, with every input.
- Covered by the brokerage’s approved disclaimer.
What these pages look like
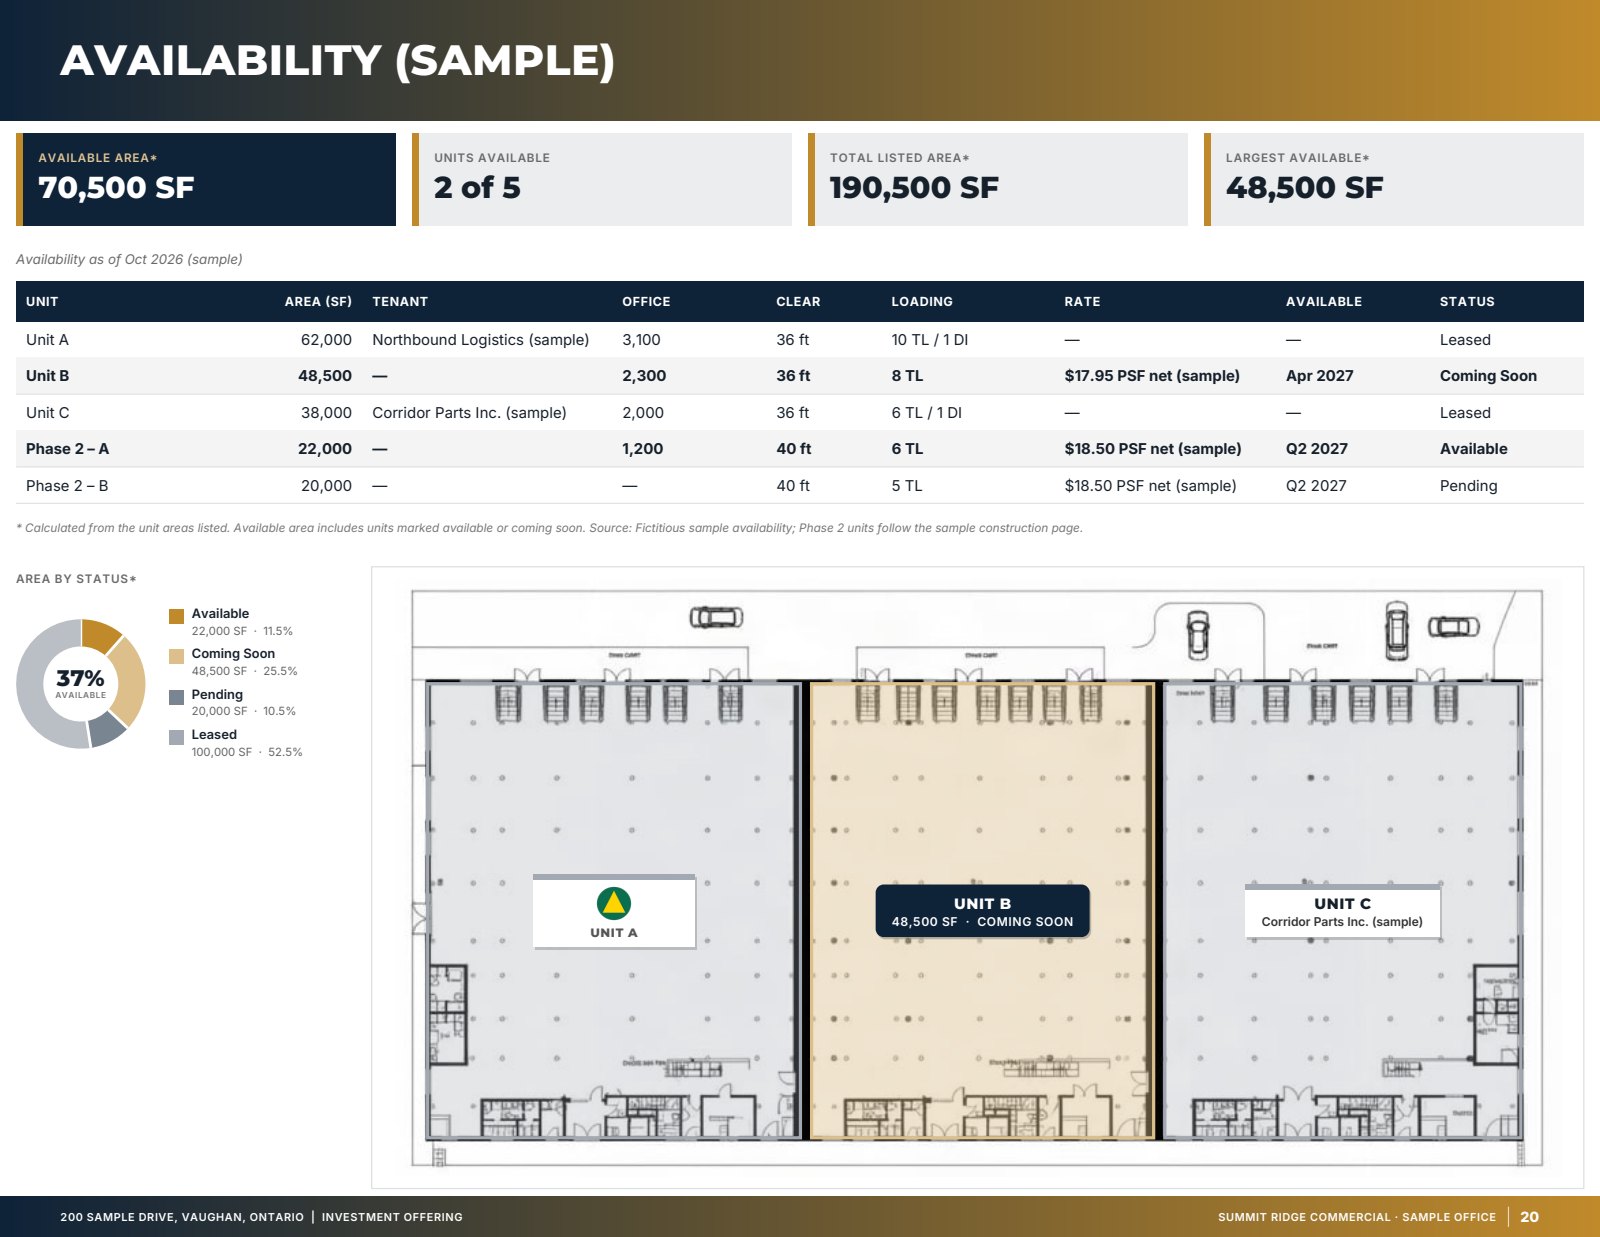
Sample — fictitious property. Pages generated by the product for an invented sample listing with an invented brokerage brand. Figures marked (sample) are not real.
Related
Last updated 2026-10-17. General information for commercial real estate professionals, not legal advice.
Start with the fact sheet you already have.
Upload it, answer only what’s missing for the output you choose, and review a watermarked preview before you buy anything.