CRE marketing guide
The market overview in an offering memorandum: which figures to show and how to source them
How to write the market overview of a commercial real estate OM: choosing the submarket, the six figures that matter, trend charts, dating and sourcing.
What the market page has to do
The market overview tells a buyer whether the property sits in a market that supports the price and the business plan. It answers a few practical questions: how much space of this type exists nearby, how much of it is empty, where rents and values have been going, and what new supply is coming. A good market page is short, dated and sourced. A weak one is two pages of general economic commentary about the region that could sit in any document.
It is usually placed after the location pages and before the comparables, so that the reader moves from the site, to the area, to the market, to the evidence of value.
Pick the right market
Define the market the way a buyer of this property would. That is usually the submarket used by the main research providers and brokerages for the asset type, not the whole metropolitan area and not the province or state. A suburban industrial building is compared with industrial space in its node or along its highway corridor; a downtown office building with the downtown or financial-core office market; a neighbourhood retail plaza with its trade area.
Name the submarket and say how it is defined if the name is not obvious. If the property sits on the edge of two submarkets, pick the one buyers will benchmark against and mention the other in one line.
The figures that matter by property type
Six figures are usually enough. More than that and the page turns into a data dump. Choose them for the asset type:
- Industrial: total inventory, availability or vacancy rate, average asking net rent, net absorption, space under construction, and recent completions.
- Office: inventory, vacancy or availability rate, sublet space on the market, average asking net rent, net absorption, and new supply.
- Retail: vacancy in the trade area or centre type, asking rents for comparable units, and population and household spending in the trade area.
- Multifamily: vacancy rate, average rent by unit type, rent change over the period, and units under construction. In Canada, the national housing agency’s rental market data is a common source; in the US, public and private rent surveys are.
- Land: recent land sales and their price per acre, hectare or buildable square foot, permits or approvals in the area, and planned infrastructure.
- Hotels: market occupancy, average daily rate and RevPAR for the competitive set, and new rooms opening.
Show the change, not just the level. "Vacancy 4.1%, down 0.6 points year over year" says more than "vacancy 4.1%". Make sure every figure is for the same period and the same definition: availability and vacancy are different measures, and net and gross rents are not comparable.
Trend charts
One chart is often worth more than a paragraph. A line chart of vacancy or asking rent over five to ten years shows where the market sits in its cycle. Keep it simple: one series, labelled axes, the unit stated, and the source and date below it. Avoid charts that start the vertical axis at an arbitrary value to exaggerate a change.
Dating and sourcing every figure
Market data goes out of date quickly, and a buyer will compare your figures with their own research. Every figure on the page should say which quarter or year it describes and where it came from: a named research report, a brokerage market report, a government statistics agency or the broker’s own survey. If you calculated a figure yourself, say how.
Never present an estimate as a fact or round a number in your favour. If the latest data you can source is several quarters old, say so; buyers forgive old data far more easily than wrong data.
Writing the text
Two to four short paragraphs are enough. Say what the figures mean for this property: whether low vacancy supports re-leasing at market rent, whether new supply will compete with it, whether the trend favours an owner-user or an investor. Avoid predicting rents or values: describe what has happened and leave the forecast to the buyer, or attribute any forecast to its source.
Leave out general statements about the national economy unless they bear directly on this market. A paragraph on interest rates is rarely what a buyer needs from a listing document.
Where the data usually comes from
Most brokerages publish quarterly market reports for the main asset types, and many of the figures buyers expect come from those reports or from subscription research platforms. Public sources fill in the rest. In Canada, Statistics Canada publishes population, labour force and building permit data, and the national housing agency publishes rental market surveys. In the United States, the Census Bureau and the Bureau of Labor Statistics cover population, households and employment, and many cities publish permit and development activity. Municipal and regional planning departments are often the best source for planned infrastructure and new supply.
Whatever the source, use it consistently: take all the figures on the page from the same report and period where you can, so they can be compared with each other.
How much market content a document needs
The depth of the market section should match the document. A full offering memorandum for an investment sale usually carries a full market page, and sometimes a second page for the wider economy or a specific sector such as logistics or life sciences. A leasing brochure for a single unit rarely needs more than a short paragraph on the location and one or two figures such as availability in the node. A teaser carries none: the reader has not yet signed a confidentiality agreement, and the teaser’s job is to get them to ask for more.
Common mistakes
- Using metropolitan figures when the property competes in a much smaller submarket.
- Mixing vacancy and availability, or net and gross rents, on the same page.
- Figures with no date or no source.
- Copying a research report’s commentary instead of saying what it means for this property.
- Cherry-picking the one favourable statistic and leaving out new supply.
- Market pages in a brochure for a small lease, where a short paragraph on the location would do.
Building the market page with OfferingStack
In the OfferingStack builder the market overview has a submarket name, an “as of” date, up to six paragraphs, up to six statistics (each with a label, a value and an optional change, printed up or down in colour) and an optional trend line of 2 to 16 points with its label and unit. A source line prints below the figures. The page appears in the full OM when you have entered statistics, a trend or text; photos of the listing fill any space the figures leave.
OfferingStack does not invent market data. You type the figures from your own research, or use the optional research assistant, which searches the web and suggests a submarket, a date and up to six statistics, each with a link to its source and marked “researched, verify”. Suggestions are never written into your document until you accept them, and the trend chart is always yours to enter. The AI writer can draft the market text from the figures you entered, again only as a suggestion you accept.
What these pages look like
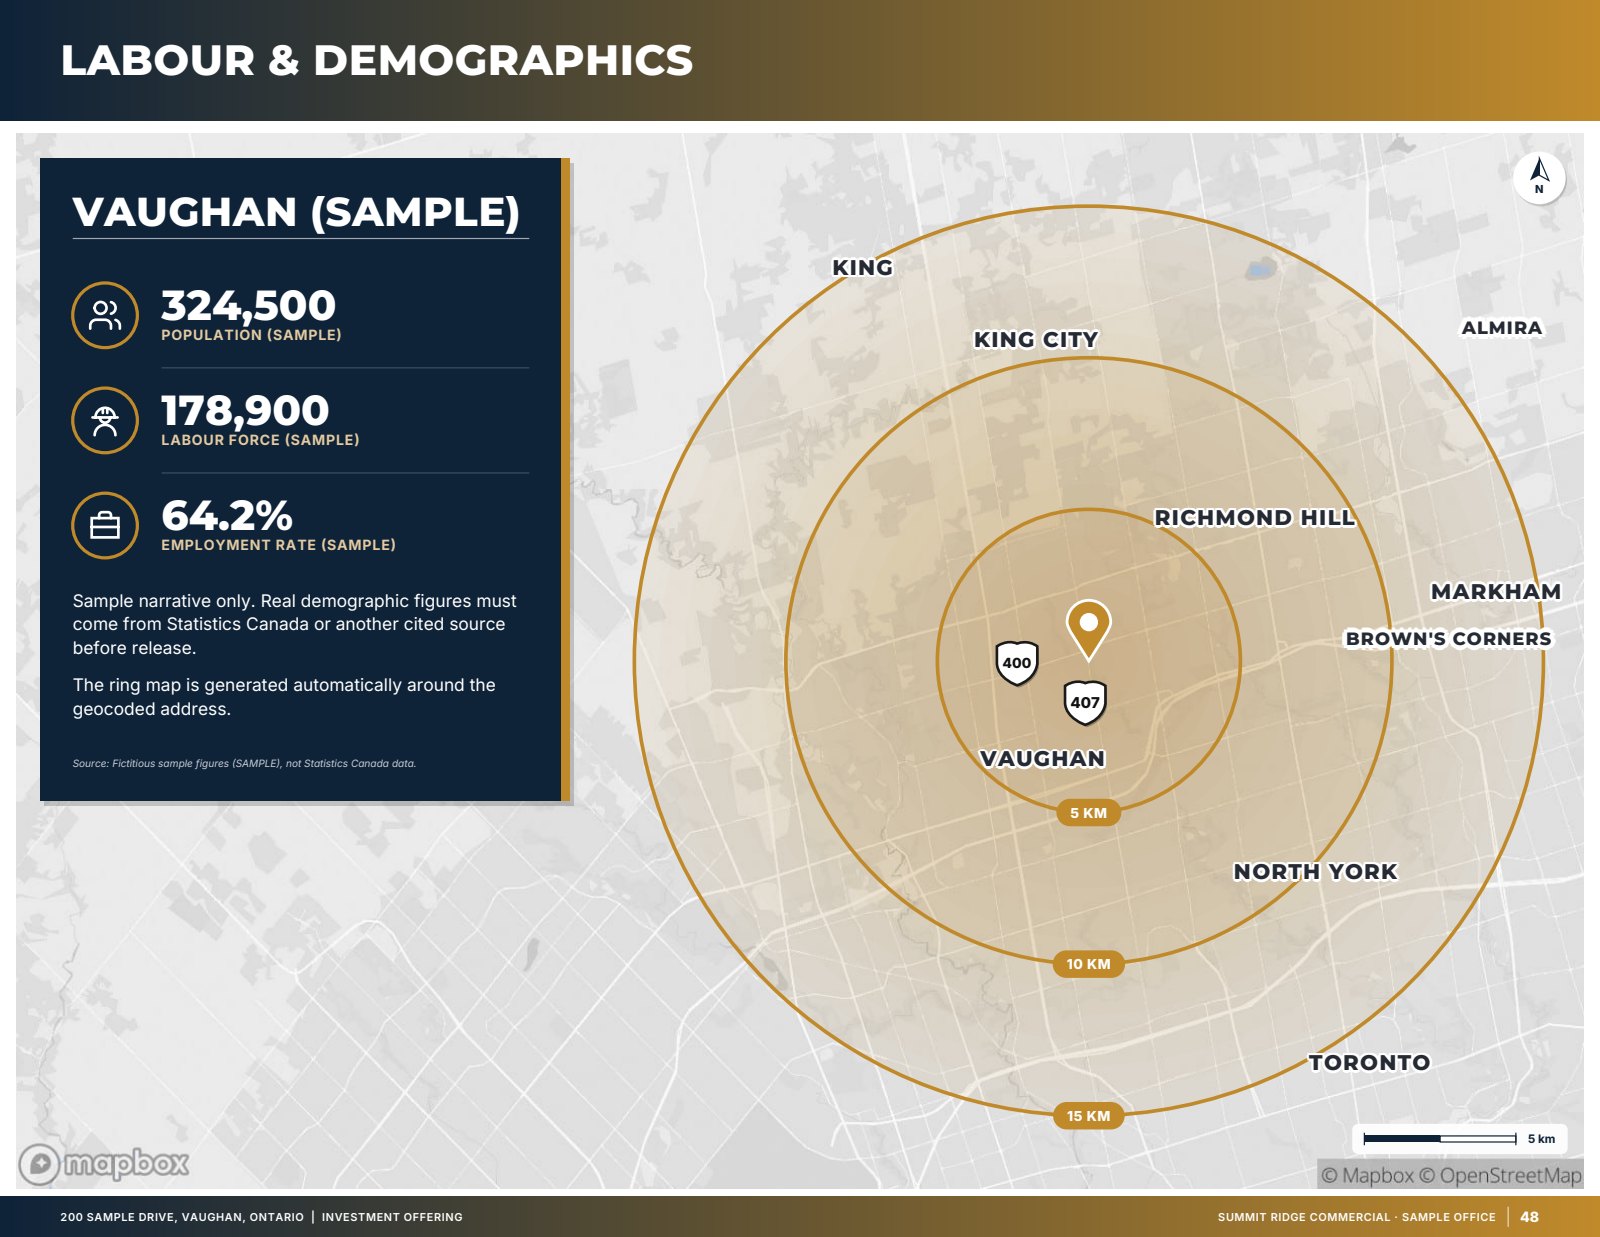
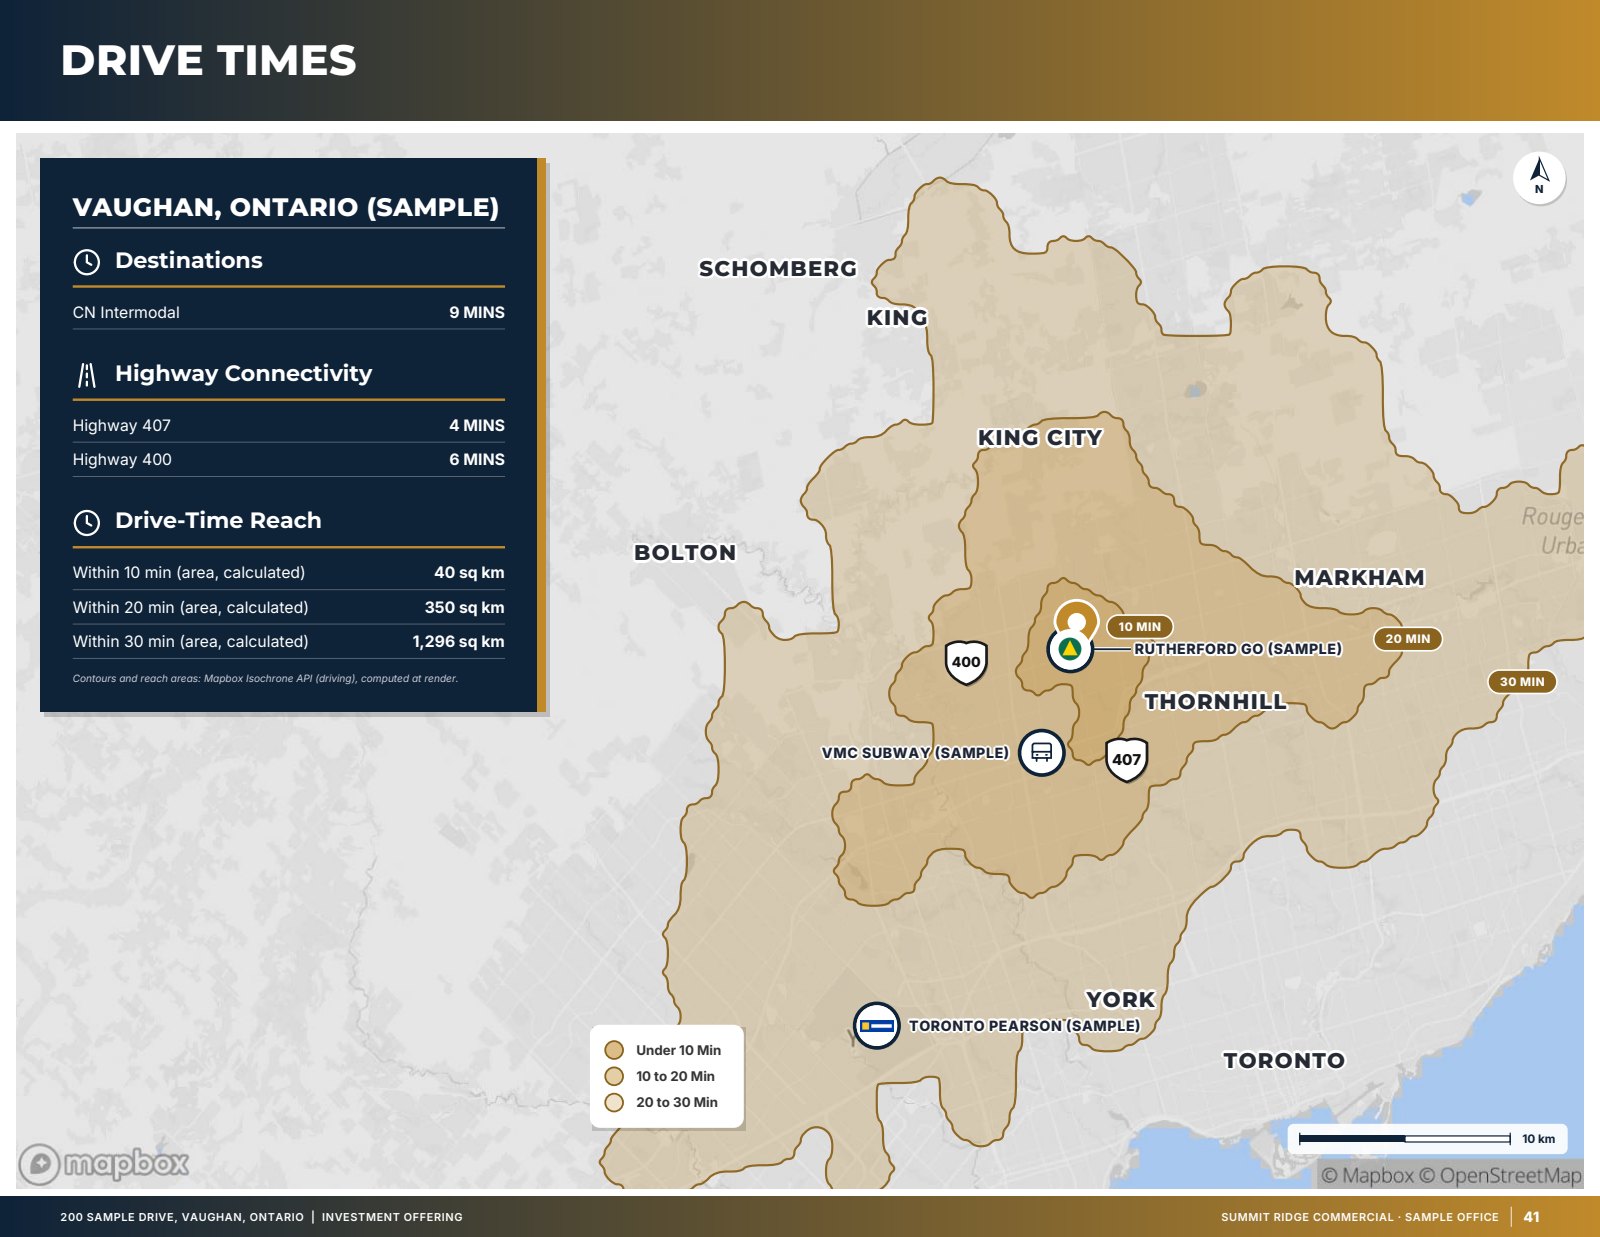
Sample — fictitious property. Pages generated by the product for an invented sample listing with an invented brokerage brand. Figures marked (sample) are not real.
Related
Last updated 2026-10-17. General information for commercial real estate professionals, not legal advice.
Start with the fact sheet you already have.
Upload it, answer only what’s missing for the output you choose, and review a watermarked preview before you buy anything.